
- Start >
- Rivers >
- Discharge >
- Bayern >
- Gampelmühle >
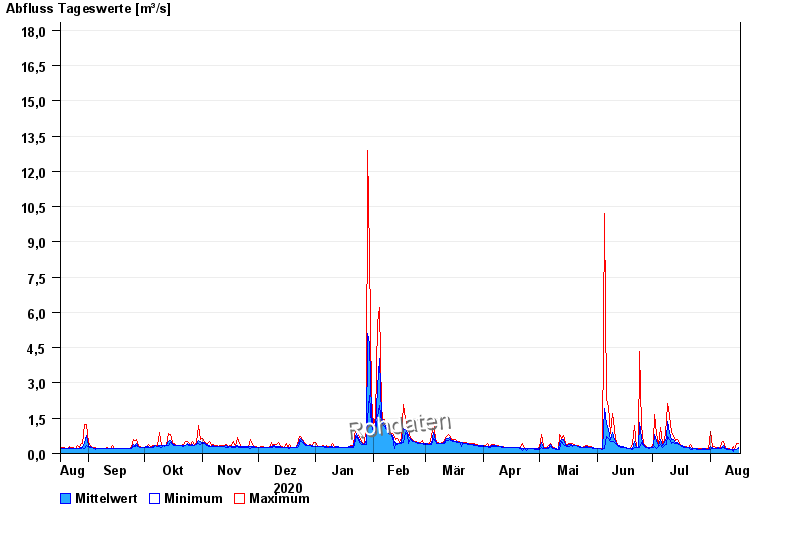
- Chart of year

Chart of year Gampelmühle / Ölschnitz
Discharge from 17.08.2020 to 16.08.2021
- 06.06.1984 Abfluss: 25,5 m³/s
- 16.08.1972 Abfluss: 20,4 m³/s
- 23.02.1970 Abfluss: 19,8 m³/s
- 26.01.1995 Abfluss: 19,7 m³/s
- 28.05.2006 Abfluss: 18,5 m³/s
| Date | Mean value [m³/s] | Maximum [m³/s] | Minimum [m³/s] |
|---|---|---|---|
| 16.08.2021 | 0.247 | 0.416 | 0.207 |
| 15.08.2021 | 0.188 | 0.436 | 0.167 |
| 14.08.2021 | 0.174 | 0.179 | 0.167 |
| 13.08.2021 | 0.178 | 0.291 | 0.099 |
| 12.08.2021 | 0.179 | 0.179 | 0.167 |
| 11.08.2021 | 0.187 | 0.193 | 0.179 |
| 10.08.2021 | 0.196 | 0.207 | 0.179 |
© Bayerisches Landesamt für Umwelt 2024