
- Start >
- Rivers >
- Discharge >
- Bayern >
- Gampelmühle >
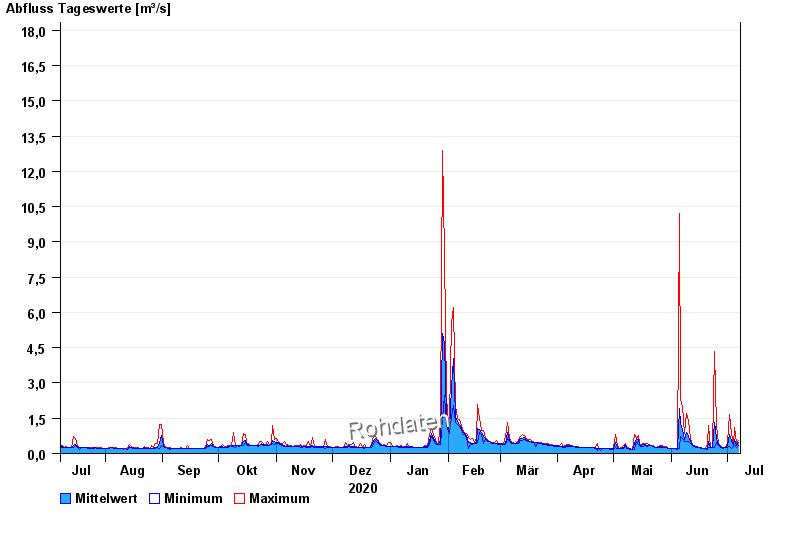
- Chart of year

Chart of year Gampelmühle / Ölschnitz
Discharge from 08.07.2020 to 07.07.2021
- 06.06.1984 Abfluss: 25,5 m³/s
- 16.08.1972 Abfluss: 20,4 m³/s
- 23.02.1970 Abfluss: 19,8 m³/s
- 26.01.1995 Abfluss: 19,7 m³/s
- 28.05.2006 Abfluss: 18,5 m³/s
| Date | Mean value [m³/s] | Maximum [m³/s] | Minimum [m³/s] |
|---|---|---|---|
| 07.07.2021 | 0.449 | 0.532 | 0.33 |
| 06.07.2021 | 0.353 | 0.416 | 0.273 |
| 05.07.2021 | 0.598 | 1.11 | 0.393 |
| 04.07.2021 | 0.35 | 0.393 | 0.311 |
| 03.07.2021 | 0.54 | 0.85 | 0.207 |
| 02.07.2021 | 0.792 | 1.65 | 0.311 |
| 01.07.2021 | 0.36 | 0.484 | 0.239 |
© Bayerisches Landesamt für Umwelt 2024