
- Start >
- Rivers >
- Discharge >
- Bayern >
- Gampelmühle >
- Chart of year

Chart of year Gampelmühle / Ölschnitz
Discharge from 19.08.2023 to 18.08.2024
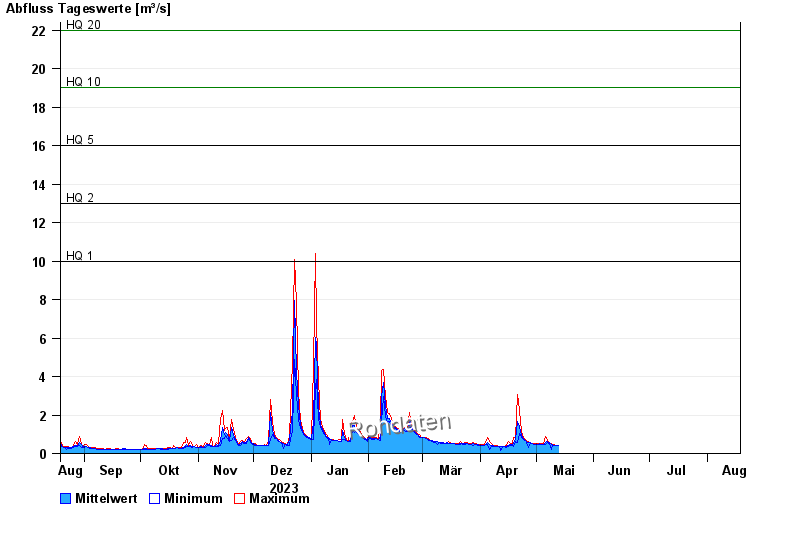
- HQ1 10 m³/s
- HQ2 13 m³/s
- HQ5 16 m³/s
- HQ10 19 m³/s
- HQ20 22 m³/s
- HQ50 26 m³/s
- HQ100 28 m³/s
| Date | Mean value [m³/s] | Maximum [m³/s] | Minimum [m³/s] |
|---|---|---|---|
| 28.04.2024 | 0.55 | 0.57 | 0.544 |
| 27.04.2024 | 0.58 | 0.62 | 0.302 |
| 26.04.2024 | 0.64 | 0.672 | 0.594 |
| 25.04.2024 | 0.699 | 0.725 | 0.672 |
| 24.04.2024 | 0.777 | 0.808 | 0.725 |
| 23.04.2024 | 0.949 | 1.13 | 0.837 |
| 22.04.2024 | 1.4 | 2.22 | 1.04 |
© Bayerisches Landesamt für Umwelt 2024