

Chart of year Gaden / Schinderbach
Discharge from 08.11.2023 to 07.11.2024
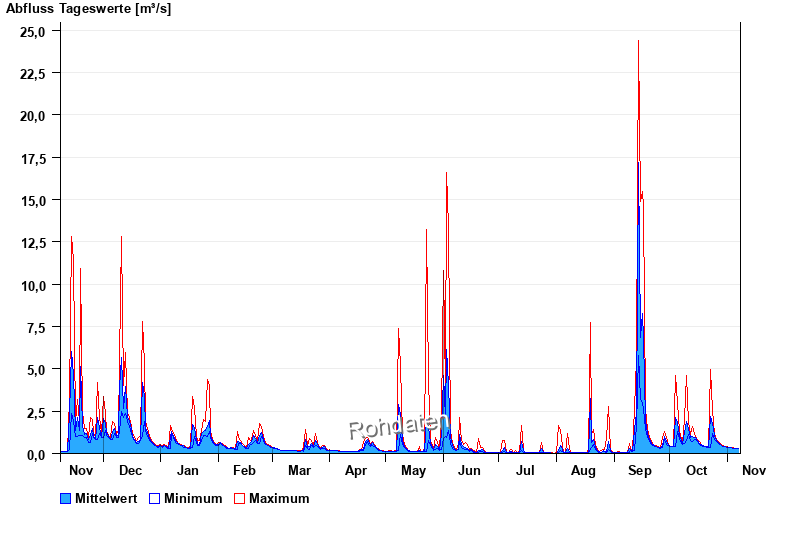
note
Datenabruf nur 07:00, 15:00 und 23:00 MEZ.
Bei Hochwasser kontinuierlich.
| Date | Mean value [m³/s] | Maximum [m³/s] | Minimum [m³/s] |
|---|---|---|---|
| 07.11.2024 | 0.272 | 0.272 | 0.272 |
| 06.11.2024 | 0.272 | 0.272 | 0.272 |
| 05.11.2024 | 0.272 | 0.272 | 0.272 |
| 04.11.2024 | 0.308 | 0.329 | 0.272 |
| 03.11.2024 | 0.329 | 0.329 | 0.329 |
| 02.11.2024 | 0.329 | 0.329 | 0.329 |
| 01.11.2024 | 0.378 | 0.393 | 0.329 |
© Bayerisches Landesamt für Umwelt 2025