
- Start >
- Rivers >
- Discharge >
- Bayern >
- Frauenkreuz >
- Chart of year

Chart of year Frauenkreuz / Gründlach
Discharge from 31.05.2022 to 30.05.2023
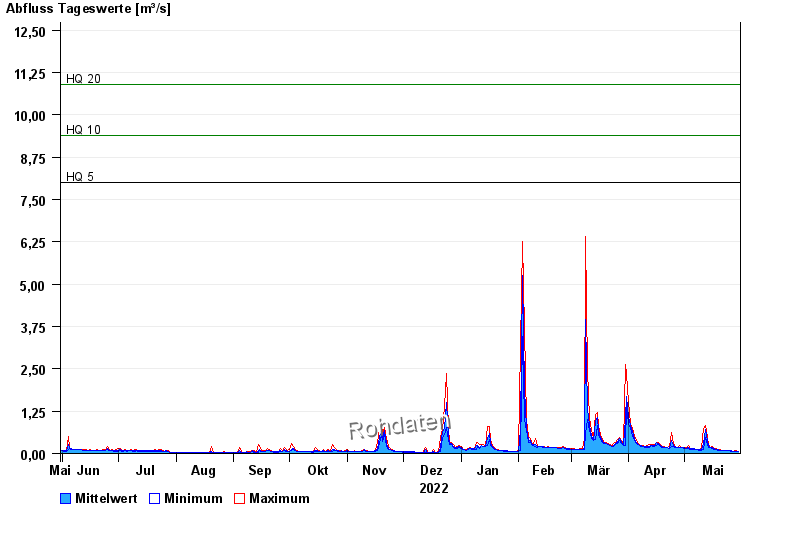
- HQ5 8 m³/s
- HQ10 9,4 m³/s
- HQ20 10,9 m³/s
- HQ100 14,3 m³/s
| Date | Mean value [m³/s] | Maximum [m³/s] | Minimum [m³/s] |
|---|---|---|---|
| 30.05.2023 | 0.062 | 0.066 | 0.052 |
| 29.05.2023 | 0.07 | 0.1 | 0.058 |
| 28.05.2023 | 0.069 | 0.1 | 0.066 |
| 27.05.2023 | 0.07 | 0.073 | 0.066 |
| 26.05.2023 | 0.079 | 0.082 | 0.073 |
| 25.05.2023 | 0.082 | 0.082 | 0.082 |
| 24.05.2023 | 0.083 | 0.091 | 0.082 |
© Bayerisches Landesamt für Umwelt 2024