
- Start >
- Rivers >
- Discharge >
- Bayern >
- Frammersbach >
- Chart of total period

Chart of total period Frammersbach / Lohr
Discharge from 01.11.1962 to 26.04.2024
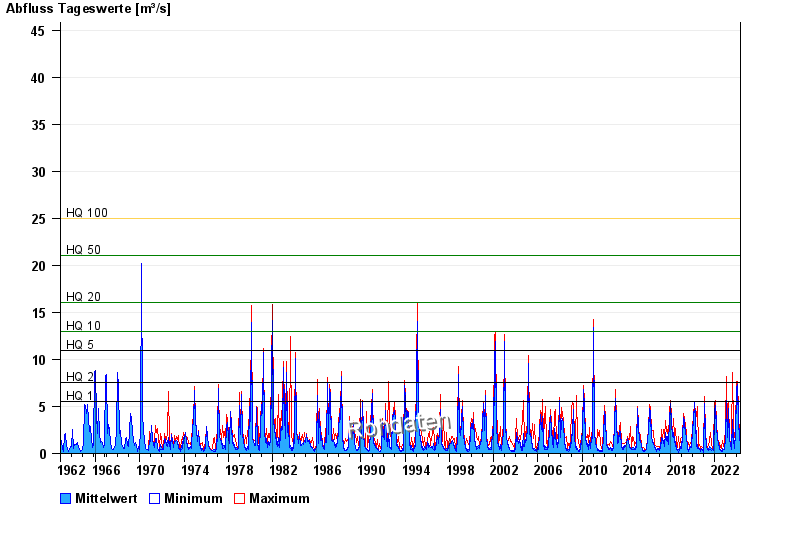
- HQ1 5,5 m³/s
- HQ2 7,6 m³/s
- HQ5 11 m³/s
- HQ10 13 m³/s
- HQ20 16 m³/s
- HQ50 21 m³/s
- HQ100 25 m³/s
| Date | Mean value [m³/s] | Maximum [m³/s] | Minimum [m³/s] |
|---|---|---|---|
| 26.04.2024 | 1.51 | 1.51 | 1.51 |
| 25.04.2024 | 1.56 | 1.61 | 1.51 |
| 24.04.2024 | 1.45 | 1.51 | 1.4 |
| 23.04.2024 | 1.32 | 1.4 | 1.21 |
| 22.04.2024 | 1.21 | 1.3 | 1.11 |
| 21.04.2024 | 1.24 | 1.3 | 1.03 |
| 20.04.2024 | 1.12 | 1.3 | 1.03 |
© Bayerisches Landesamt für Umwelt 2024