
- Start >
- Rivers >
- Discharge >
- Bayern >
- Förmitz Speicherabfluss >
- Chart of year

Chart of year Förmitz Speicherabfluss / Förmitz
Discharge from 01.01.2022 to 31.12.2022
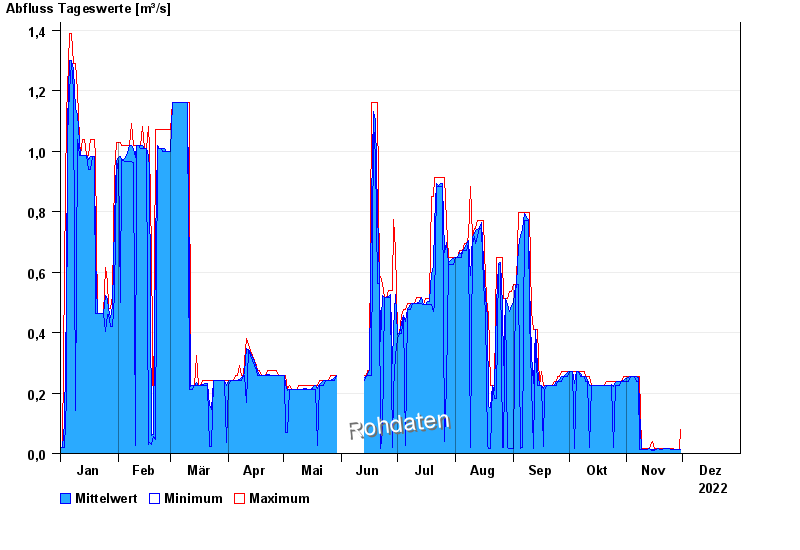
| Date | Mean value [m³/s] | Maximum [m³/s] | Minimum [m³/s] |
|---|---|---|---|
| 30.11.2022 | 0.014 | 0.079 | 0.012 |
| 29.11.2022 | 0.012 | 0.012 | 0.012 |
| 28.11.2022 | 0.012 | 0.012 | 0.012 |
| 27.11.2022 | 0.012 | 0.012 | 0.012 |
| 26.11.2022 | 0.014 | 0.015 | 0.012 |
| 25.11.2022 | 0.015 | 0.015 | 0.012 |
| 24.11.2022 | 0.015 | 0.015 | 0.015 |
© Bayerisches Landesamt für Umwelt 2024