
- Start >
- Rivers >
- Discharge >
- Bayern >
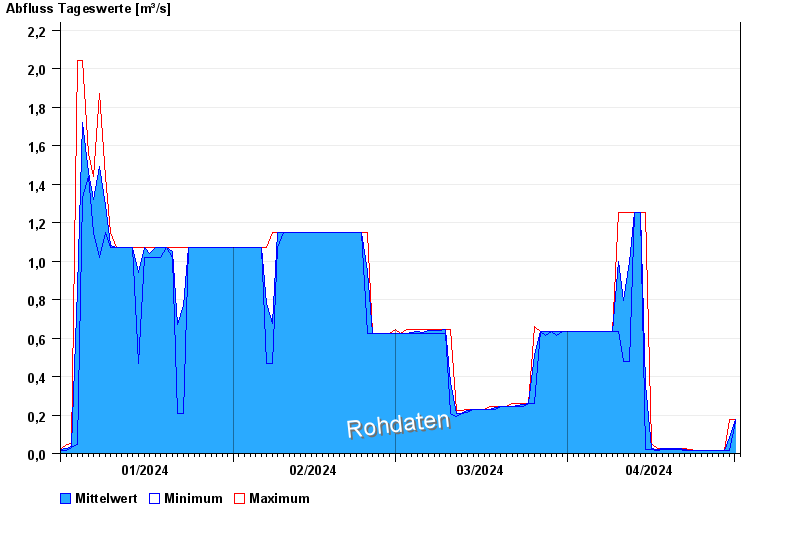
- Förmitz Speicherabfluss >
- Chart of year

Chart of year Förmitz Speicherabfluss / Förmitz
Discharge from 01.01.2024 to 01.05.2024
| Date | Mean value [m³/s] | Maximum [m³/s] | Minimum [m³/s] |
|---|---|---|---|
| 01.05.2024 | 0.213 | 0.213 | 0.198 |
| 30.04.2024 | 0.105 | 0.213 | 0.017 |
| 29.04.2024 | 0.018 | 0.019 | 0.017 |
| 28.04.2024 | 0.018 | 0.019 | 0.017 |
| 27.04.2024 | 0.018 | 0.019 | 0.017 |
| 26.04.2024 | 0.017 | 0.019 | 0.01 |
| 25.04.2024 | 0.018 | 0.019 | 0.017 |
© Bayerisches Landesamt für Umwelt 2024