

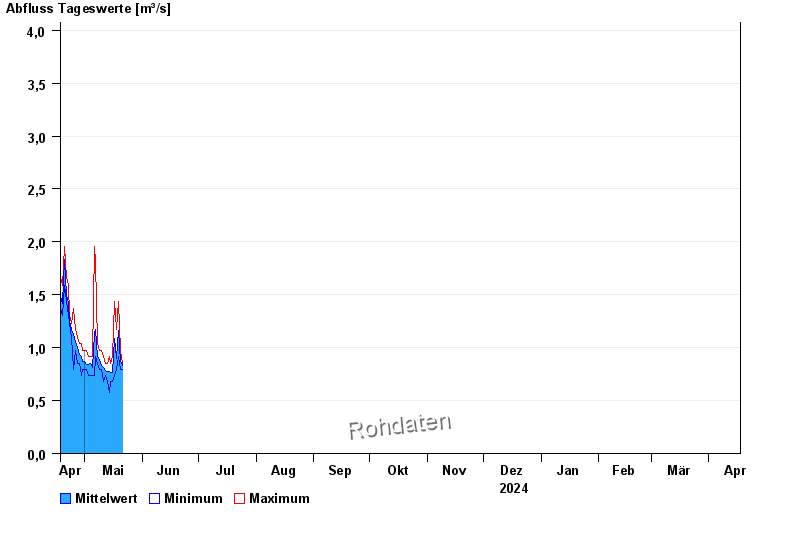
Chart of year Fischach / Schmutter
Discharge from 18.04.2024 to 17.04.2025
- HQ1 16 m³/s
- HQ2 20 m³/s
- HQ5 25 m³/s
- HQ10 35 m³/s
- HQ20 45 m³/s
- HQ50 60 m³/s
- HQ100 75 m³/s
| Date | Mean value [m³/s] | Maximum [m³/s] | Minimum [m³/s] |
|---|---|---|---|
| 06.06.2024 | 5.21 | 5.4 | 5.13 |
| 05.06.2024 | 5.68 | 6.06 | 5.4 |
| 04.06.2024 | 6.85 | 8.09 | 4.5 |
| 03.06.2024 | 10.4 | 14.3 | 8.19 |
| 02.06.2024 | 30.4 | 50.1 | 14.4 |
| 01.06.2024 | 59.1 | 79.9 | 42 |
| 31.05.2024 | 12.8 | 40.2 | 2.94 |
© Bayerisches Landesamt für Umwelt 2024