
- Start >
- Rivers >
- Discharge >
- Bayern >
- Feldolling >
- Chart of year

Chart of year Feldolling / Mangfall
Discharge from 06.12.2021 to 05.12.2022
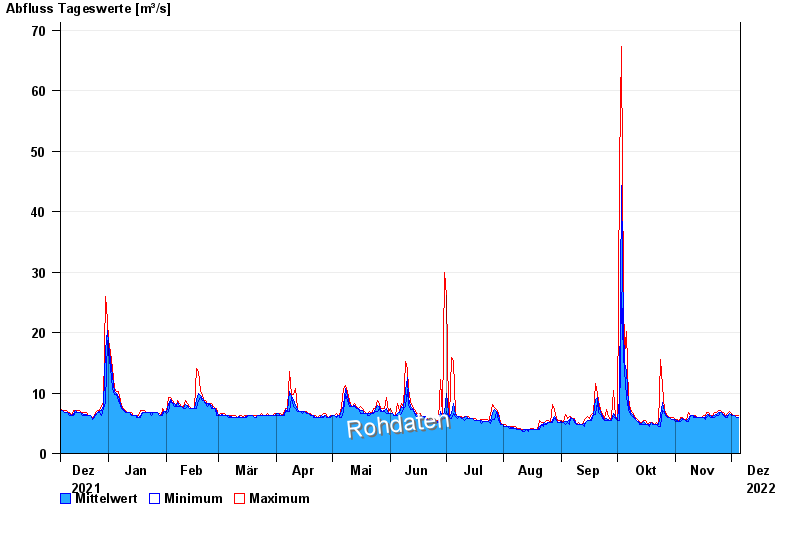
| Date | Mean value [m³/s] | Maximum [m³/s] | Minimum [m³/s] |
|---|---|---|---|
| 05.12.2022 | 5.97 | 6.24 | 5.89 |
| 04.12.2022 | 6 | 6.24 | 5.89 |
| 03.12.2022 | 6.24 | 6.24 | 6.24 |
| 02.12.2022 | 6.24 | 6.24 | 6.24 |
| 01.12.2022 | 6.52 | 6.62 | 6.24 |
| 30.11.2022 | 6.63 | 7.01 | 6.62 |
| 29.11.2022 | 6.35 | 6.62 | 5.89 |
© Bayerisches Landesamt für Umwelt 2024