
- Start >
- Rivers >
- Discharge >
- Bayern >
- Feldolling >
- Chart of year

Chart of year Feldolling / Mangfall
Discharge from 01.01.2024 to 31.12.2024
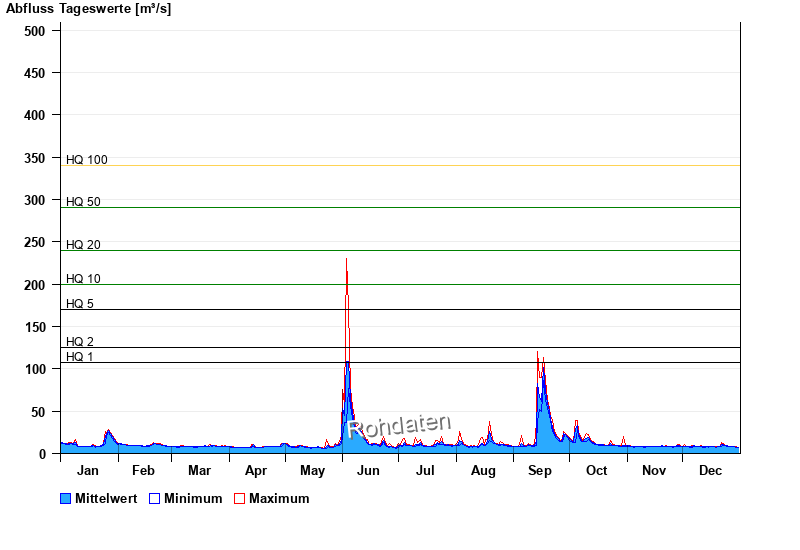
- HQ1 108 m³/s
- HQ2 125 m³/s
- HQ5 170 m³/s
- HQ10 200 m³/s
- HQ20 240 m³/s
- HQ50 290 m³/s
- HQ100 340 m³/s
| Date | Mean value [m³/s] | Maximum [m³/s] | Minimum [m³/s] |
|---|---|---|---|
| 31.12.2024 | 7.43 | 7.43 | 7.43 |
| 30.12.2024 | 7.64 | 7.85 | 7.43 |
| 29.12.2024 | 7.85 | 7.85 | 7.85 |
| 28.12.2024 | 7.91 | 8.27 | 7.85 |
| 27.12.2024 | 8.47 | 8.76 | 8.27 |
| 26.12.2024 | 8.76 | 8.76 | 8.76 |
| 25.12.2024 | 9.15 | 9.2 | 8.76 |
© Bayerisches Landesamt für Umwelt 2025