

Chart of year Erbendorf / Fichtelnaab
Discharge from 01.01.2022 to 31.12.2022
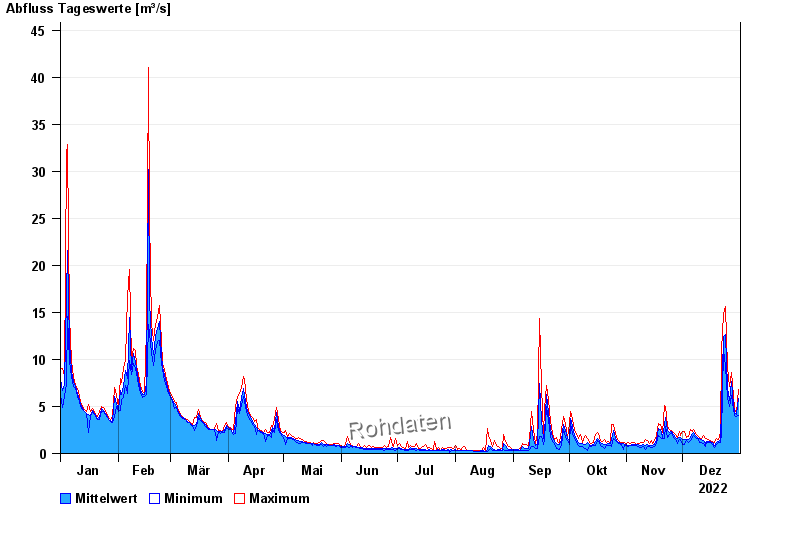
| Date | Mean value [m³/s] | Maximum [m³/s] | Minimum [m³/s] |
|---|---|---|---|
| 31.12.2022 | 5.82 | 6.77 | 4.02 |
| 30.12.2022 | 4.12 | 4.35 | 3.92 |
| 29.12.2022 | 4.35 | 4.67 | 4.02 |
| 28.12.2022 | 5.23 | 6.16 | 4.67 |
| 27.12.2022 | 7.66 | 8.56 | 6.16 |
| 26.12.2022 | 5.59 | 7.14 | 5 |
| 25.12.2022 | 7.05 | 9.09 | 5.81 |
© Bayerisches Landesamt für Umwelt 2024