

Chart of year Erbendorf / Fichtelnaab
Discharge from 01.01.2024 to 27.04.2024
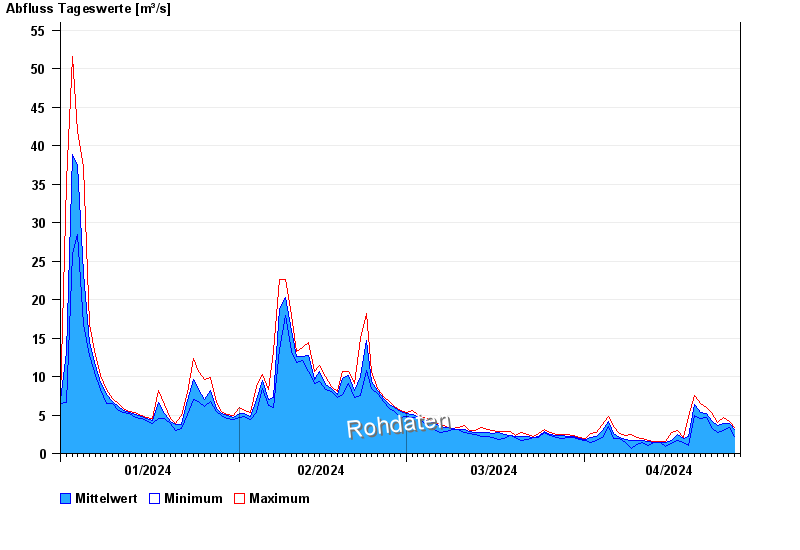
| Date | Mean value [m³/s] | Maximum [m³/s] | Minimum [m³/s] |
|---|---|---|---|
| 27.04.2024 | 3.28 | 3.37 | 3.27 |
| 26.04.2024 | 3.86 | 4.2 | 3.37 |
| 25.04.2024 | 3.92 | 4.63 | 2.97 |
| 24.04.2024 | 3.66 | 4.09 | 2.78 |
| 23.04.2024 | 4.33 | 5.3 | 3.37 |
| 22.04.2024 | 5.18 | 6 | 4.63 |
| 21.04.2024 | 5.34 | 6.48 | 4.52 |
© Bayerisches Landesamt für Umwelt 2024