

Chart of year Engen / Illach
Discharge from 06.12.2021 to 05.12.2022
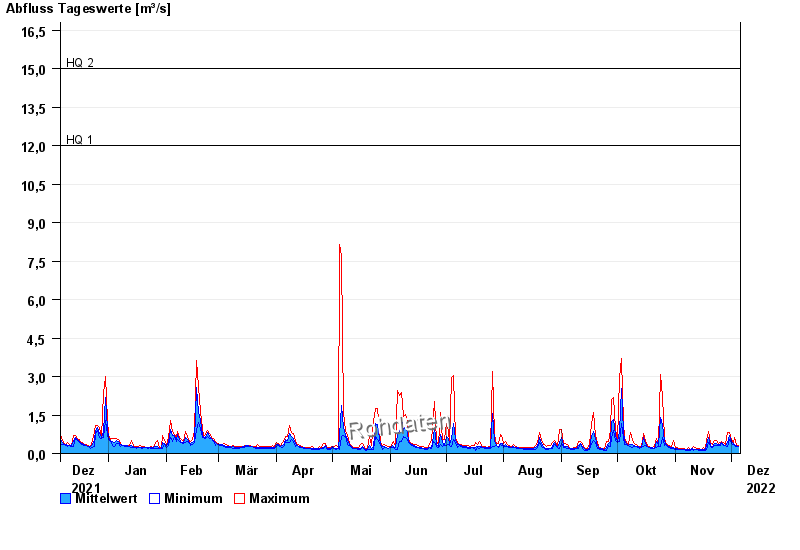
- HQ1 12 m³/s
- HQ2 15 m³/s
- HQ5 18 m³/s
- HQ10 23 m³/s
- HQ20 27 m³/s
- HQ50 34 m³/s
- HQ100 40 m³/s
| Date | Mean value [m³/s] | Maximum [m³/s] | Minimum [m³/s] |
|---|---|---|---|
| 05.12.2022 | 0.286 | 0.325 | 0.285 |
| 04.12.2022 | 0.304 | 0.336 | 0.257 |
| 03.12.2022 | 0.34 | 0.607 | 0.296 |
| 02.12.2022 | 0.371 | 0.421 | 0.336 |
| 01.12.2022 | 0.457 | 0.558 | 0.378 |
| 30.11.2022 | 0.7 | 0.819 | 0.558 |
| 29.11.2022 | 0.43 | 0.819 | 0.257 |
© Bayerisches Landesamt für Umwelt 2024