

Chart of year Eching / Windach
Discharge from 04.12.2021 to 03.12.2022
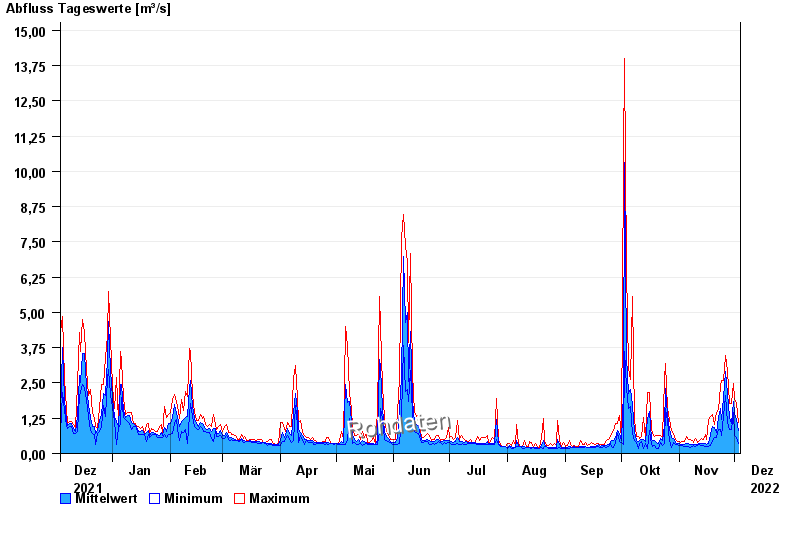
note
Pegel beeinflusst durch Kraftwerkssteuerung
| Date | Mean value [m³/s] | Maximum [m³/s] | Minimum [m³/s] |
|---|---|---|---|
| 03.12.2022 | 0.823 | 1.11 | 0.345 |
| 02.12.2022 | 1.2 | 1.78 | 0.581 |
| 01.12.2022 | 1.41 | 1.95 | 0.629 |
| 30.11.2022 | 1.83 | 2.48 | 1.47 |
| 29.11.2022 | 1.05 | 1.78 | 0.85 |
| 28.11.2022 | 1.28 | 1.78 | 0.85 |
| 27.11.2022 | 2.12 | 2.95 | 1.11 |
© Bayerisches Landesamt für Umwelt 2024