

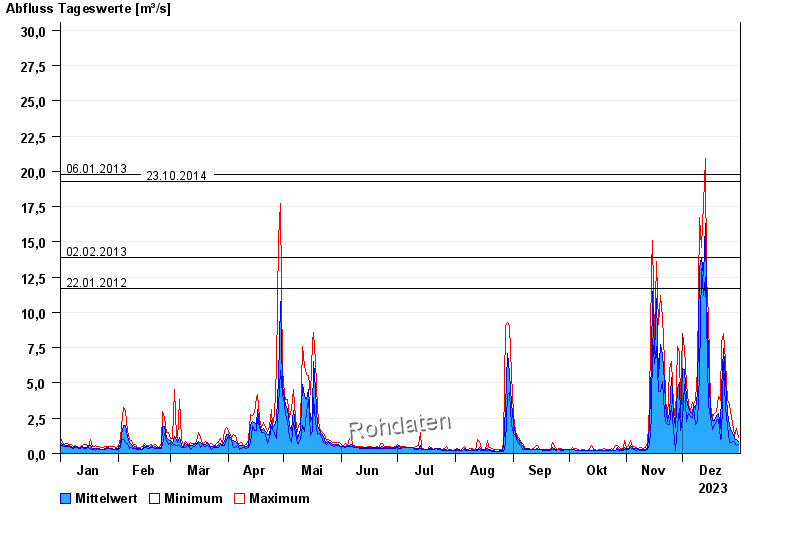
Chart of year Eching / Windach
Discharge from 01.01.2023 to 31.12.2023
note
Pegel beeinflusst durch Kraftwerkssteuerung
- 02.06.2013 Abfluss: 48 m³/s
- 06.01.2013 Abfluss: 19,8 m³/s
- 23.10.2014 Abfluss: 19,3 m³/s
- 02.02.2013 Abfluss: 13,9 m³/s
- 22.01.2012 Abfluss: 11,7 m³/s
| Date | Mean value [m³/s] | Maximum [m³/s] | Minimum [m³/s] |
|---|---|---|---|
| 31.12.2023 | 0.878 | 1.13 | 0.641 |
| 30.12.2023 | 1 | 1.78 | 0.542 |
| 29.12.2023 | 1.07 | 1.28 | 0.804 |
| 28.12.2023 | 1.38 | 1.69 | 0.865 |
| 27.12.2023 | 1.53 | 2.55 | 0.749 |
| 26.12.2023 | 1.97 | 3.5 | 0.749 |
| 25.12.2023 | 2.84 | 3.73 | 1.96 |
© Bayerisches Landesamt für Umwelt 2024