
- Start >
- Rivers >
- Discharge >
- Bayern >
- Eberhardsreuth >
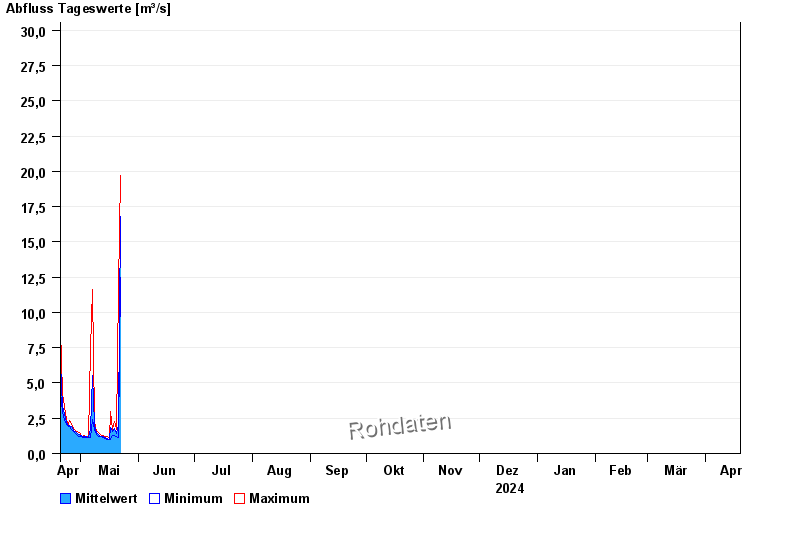
- Chart of year

Chart of year Eberhardsreuth / Mitternacher Ohe
Discharge from 20.04.2024 to 19.04.2025
- 18.07.2010 Abfluss: 73,2 m³/s
- 05.12.1988 Abfluss: 73 m³/s
- 08.12.1974 Abfluss: 51,6 m³/s
- 01.11.1998 Abfluss: 50,2 m³/s
- 12.08.2002 Abfluss: 48,5 m³/s
| Date | Mean value [m³/s] | Maximum [m³/s] | Minimum [m³/s] |
|---|---|---|---|
| 02.05.2024 | 1.17 | 1.17 | 1.17 |
| 01.05.2024 | 1.26 | 1.31 | 1.17 |
| 30.04.2024 | 1.33 | 1.47 | 1.24 |
| 29.04.2024 | 1.42 | 1.55 | 1.31 |
| 28.04.2024 | 1.53 | 1.62 | 1.39 |
| 27.04.2024 | 1.66 | 1.79 | 1.55 |
| 26.04.2024 | 1.89 | 2.05 | 1.71 |
© Bayerisches Landesamt für Umwelt 2024