
- Start >
- Rivers >
- Discharge >
- Bayern >
- Eberhardsreuth >
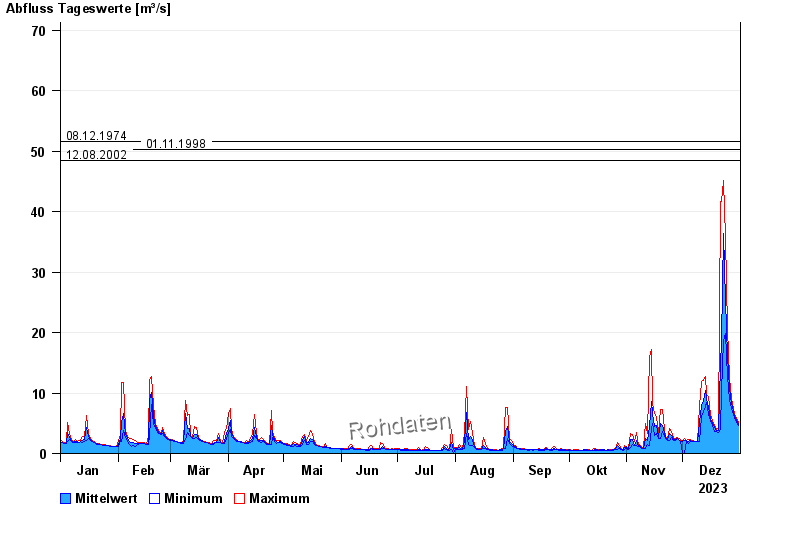
- Chart of year

Chart of year Eberhardsreuth / Mitternacher Ohe
Discharge from 01.01.2023 to 31.12.2023
- 18.07.2010 Abfluss: 73,2 m³/s
- 05.12.1988 Abfluss: 73 m³/s
- 08.12.1974 Abfluss: 51,6 m³/s
- 01.11.1998 Abfluss: 50,2 m³/s
- 12.08.2002 Abfluss: 48,5 m³/s
| Date | Mean value [m³/s] | Maximum [m³/s] | Minimum [m³/s] |
|---|---|---|---|
| 31.12.2023 | 4.86 | 5.09 | 4.67 |
| 30.12.2023 | 5.38 | 5.73 | 5.09 |
| 29.12.2023 | 6.08 | 6.6 | 5.73 |
| 28.12.2023 | 6.88 | 7.48 | 6.49 |
| 27.12.2023 | 8.21 | 9.08 | 7.48 |
| 26.12.2023 | 10.7 | 12.5 | 8.96 |
| 25.12.2023 | 16 | 20.5 | 12.7 |
© Bayerisches Landesamt für Umwelt 2024