
- Start >
- Rivers >
- Discharge >
- Bayern >
- Eberhardsreuth >
- Chart of year

Chart of year Eberhardsreuth / Mitternacher Ohe
Discharge from 19.04.2024 to 18.04.2025
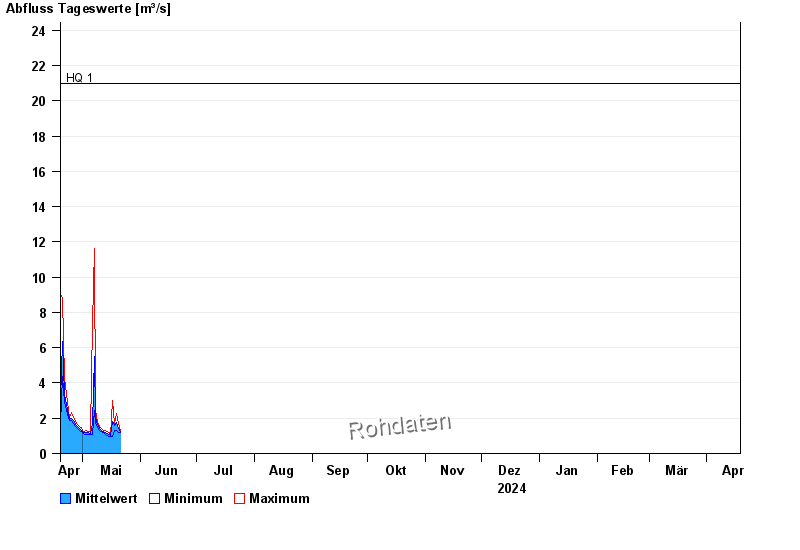
- HQ1 21 m³/s
- HQ2 27,5 m³/s
- HQ5 35 m³/s
- HQ10 42 m³/s
- HQ20 50 m³/s
- HQ50 64 m³/s
- HQ100 75 m³/s
| Date | Mean value [m³/s] | Maximum [m³/s] | Minimum [m³/s] |
|---|---|---|---|
| 22.05.2024 | 16.7 | 19.7 | 12.5 |
| 21.05.2024 | 2.09 | 11.8 | 1.1 |
| 20.05.2024 | 1.44 | 1.71 | 1.17 |
| 19.05.2024 | 1.77 | 2.24 | 1.31 |
| 18.05.2024 | 1.57 | 1.71 | 1.31 |
| 17.05.2024 | 1.84 | 3.01 | 0.973 |
| 16.05.2024 | 1.01 | 1.04 | 0.973 |
© Bayerisches Landesamt für Umwelt 2024