

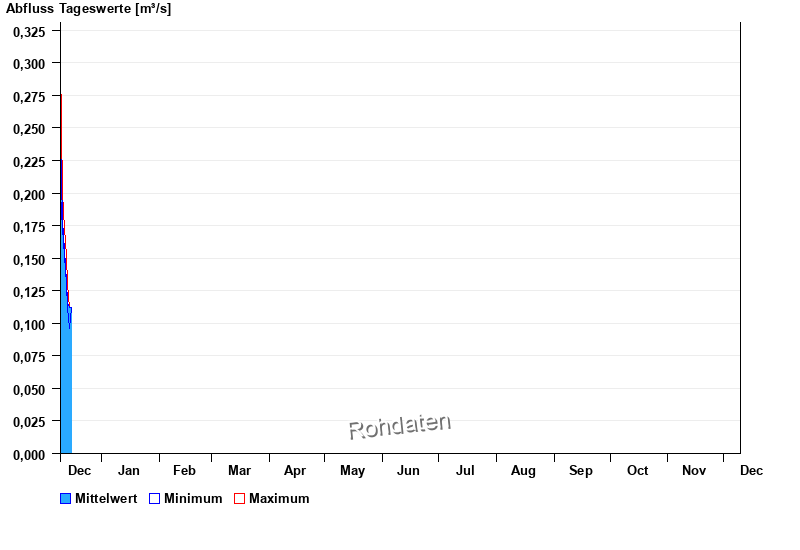
Chart of year Durach / Durach
Discharge from 10.12.2025 to 09.12.2026
- HQ1 10 m³/s
- HQ2 14 m³/s
- HQ5 20 m³/s
- HQ10 25 m³/s
- HQ20 30 m³/s
- HQ50 37 m³/s
- HQ100 43 m³/s
| Date | Mean value [m³/s] | Maximum [m³/s] | Minimum [m³/s] |
|---|---|---|---|
| 15.12.2025 | 0.112 | 0.112 | 0.112 |
| 14.12.2025 | 0.116 | 0.13 | 0.112 |
| 13.12.2025 | 0.132 | 0.151 | 0.13 |
| 12.12.2025 | 0.156 | 0.173 | 0.151 |
| 11.12.2025 | 0.179 | 0.2 | 0.173 |
| 10.12.2025 | 0.242 | 0.302 | 0.2 |
© Bayerisches Landesamt für Umwelt 2025