
- Start >
- Rivers >
- Discharge >
- Bayern >
- Dickertsmühle >
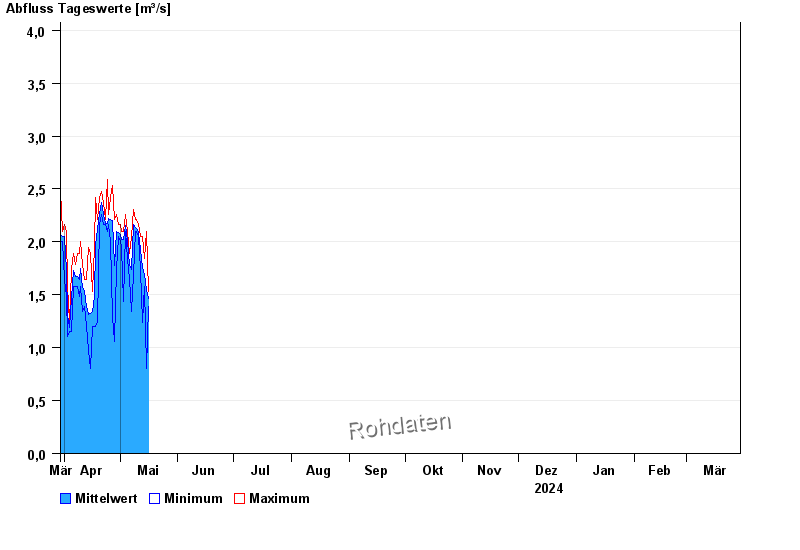
- Chart of year

Chart of year Dickertsmühle / Mühlbach
Discharge from 30.03.2024 to 29.03.2025
- 06.08.2000 Abfluss: 11,1 m³/s
- 23.06.1963 Abfluss: 9,89 m³/s
- 01.07.1954 Abfluss: 9,66 m³/s
- 01.07.1966 Abfluss: 9,05 m³/s
- 04.08.2020 Abfluss: 9,04 m³/s
| Date | Mean value [m³/s] | Maximum [m³/s] | Minimum [m³/s] |
|---|---|---|---|
| 29.04.2024 | 2.08 | 2.26 | 1.74 |
| 28.04.2024 | 1.78 | 2.21 | 1.06 |
| 27.04.2024 | 2.2 | 2.53 | 1.29 |
| 26.04.2024 | 2.21 | 2.42 | 2 |
| 25.04.2024 | 2.22 | 2.26 | 2.16 |
| 24.04.2024 | 2.17 | 2.59 | 2.1 |
| 23.04.2024 | 2.17 | 2.21 | 2.16 |
© Bayerisches Landesamt für Umwelt 2024