
- Start >
- Rivers >
- Discharge >
- Bayern >
- Dickertsmühle >
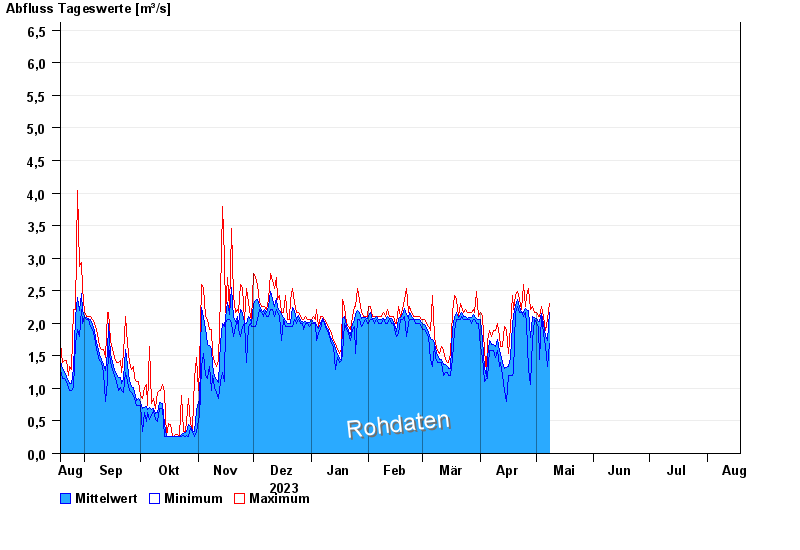
- Chart of year

Chart of year Dickertsmühle / Mühlbach
Discharge from 19.08.2023 to 18.08.2024
- 06.08.2000 Abfluss: 11,1 m³/s
- 23.06.1963 Abfluss: 9,89 m³/s
- 01.07.1954 Abfluss: 9,66 m³/s
- 01.07.1966 Abfluss: 9,05 m³/s
- 04.08.2020 Abfluss: 9,04 m³/s
| Date | Mean value [m³/s] | Maximum [m³/s] | Minimum [m³/s] |
|---|---|---|---|
| 23.05.2024 | 1.78 | 1.89 | 1.64 |
| 22.05.2024 | 1.64 | 1.74 | 1.29 |
| 21.05.2024 | 1.28 | 1.89 | 0.727 |
| 20.05.2024 | 1.37 | 1.53 | 1.2 |
| 19.05.2024 | 1.36 | 1.53 | 1.11 |
| 18.05.2024 | 1.46 | 1.58 | 1.34 |
| 17.05.2024 | 1.45 | 1.89 | 0.768 |
© Bayerisches Landesamt für Umwelt 2024