
- Start >
- Rivers >
- Discharge >
- Bayern >
- Dickertsmühle >
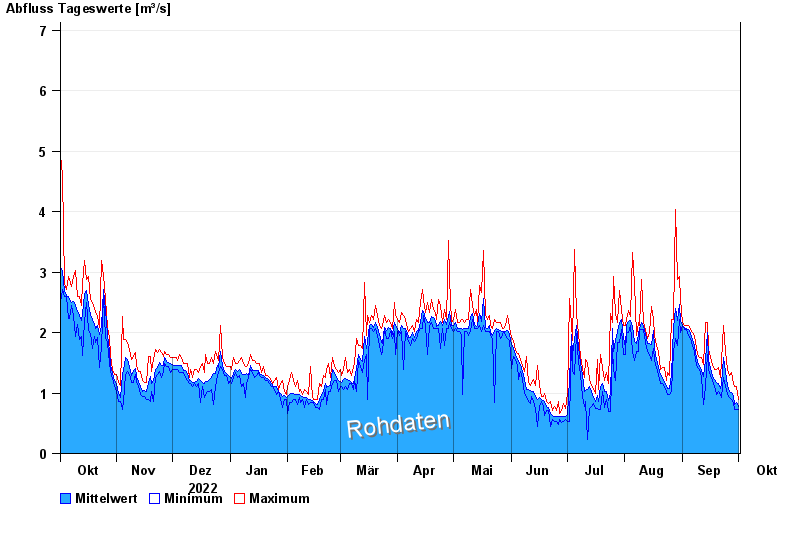
- Chart of year

Chart of year Dickertsmühle / Mühlbach
Discharge from 02.10.2022 to 01.10.2023
- 06.08.2000 Abfluss: 11,1 m³/s
- 23.06.1963 Abfluss: 9,89 m³/s
- 01.07.1954 Abfluss: 9,66 m³/s
- 01.07.1966 Abfluss: 9,05 m³/s
- 04.08.2020 Abfluss: 9,04 m³/s
| Date | Mean value [m³/s] | Maximum [m³/s] | Minimum [m³/s] |
|---|---|---|---|
| 01.10.2023 | 0.782 | 0.889 | 0.731 |
| 30.09.2023 | 0.845 | 1.11 | 0.731 |
| 29.09.2023 | 0.817 | 1.11 | 0.731 |
| 28.09.2023 | 0.943 | 1.15 | 0.847 |
| 27.09.2023 | 1.01 | 1.34 | 0.889 |
| 26.09.2023 | 1.03 | 1.29 | 0.932 |
| 25.09.2023 | 1.12 | 1.39 | 0.975 |
© Bayerisches Landesamt für Umwelt 2024