

Chart of year Deuerling / Schwarze Laber
Discharge from 01.01.2020 to 31.12.2020
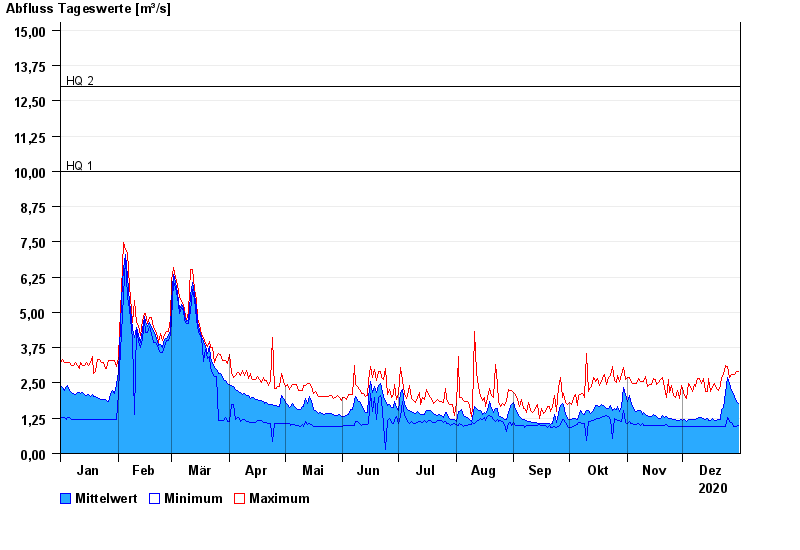
- HQ1 10 m³/s
- HQ2 13 m³/s
- HQ5 20 m³/s
- HQ10 28 m³/s
- HQ20 38 m³/s
- HQ50 60 m³/s
- HQ100 85 m³/s
| Date | Mean value [m³/s] | Maximum [m³/s] | Minimum [m³/s] |
|---|---|---|---|
| 31.12.2020 | 1.76 | 2.9 | 0.975 |
| 30.12.2020 | 1.84 | 2.9 | 0.973 |
| 29.12.2020 | 2.03 | 2.8 | 0.972 |
| 28.12.2020 | 2.08 | 2.8 | 0.972 |
| 27.12.2020 | 2.23 | 2.79 | 1.09 |
| 26.12.2020 | 2.48 | 2.7 | 1.15 |
| 25.12.2020 | 2.69 | 3.09 | 1.28 |
© Bayerisches Landesamt für Umwelt 2024