

Chart of year Deuerling / Schwarze Laber
Discharge from 01.01.2019 to 31.12.2019
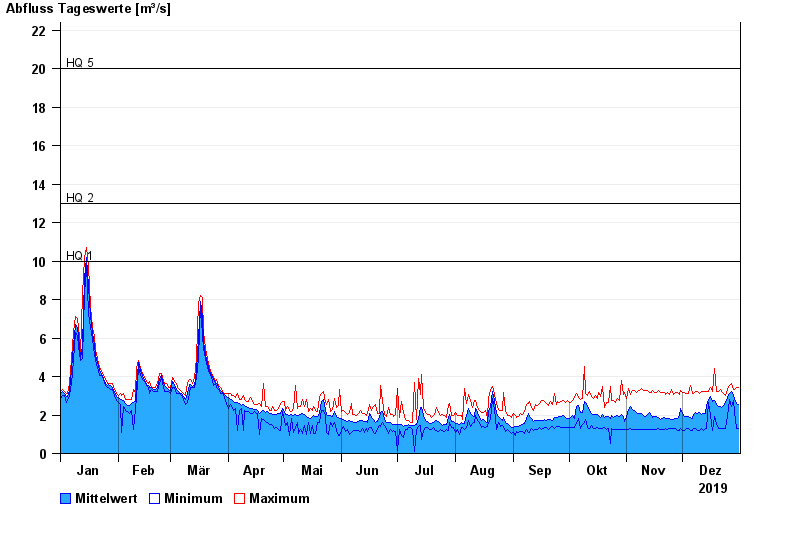
- HQ1 10 m³/s
- HQ2 13 m³/s
- HQ5 20 m³/s
- HQ10 28 m³/s
- HQ20 38 m³/s
- HQ50 60 m³/s
- HQ100 85 m³/s
| Date | Mean value [m³/s] | Maximum [m³/s] | Minimum [m³/s] |
|---|---|---|---|
| 31.12.2019 | 2.56 | 3.44 | 1.28 |
| 30.12.2019 | 2.6 | 3.44 | 1.28 |
| 29.12.2019 | 2.88 | 3.33 | 2.17 |
| 28.12.2019 | 3.04 | 3.33 | 2.73 |
| 27.12.2019 | 3.23 | 3.65 | 2.44 |
| 26.12.2019 | 3.13 | 3.54 | 2.83 |
| 25.12.2019 | 2.91 | 3.34 | 1.91 |
© Bayerisches Landesamt für Umwelt 2024