

Chart of total period Coburg / Itz
Discharge from 01.11.1925 to 16.12.2025
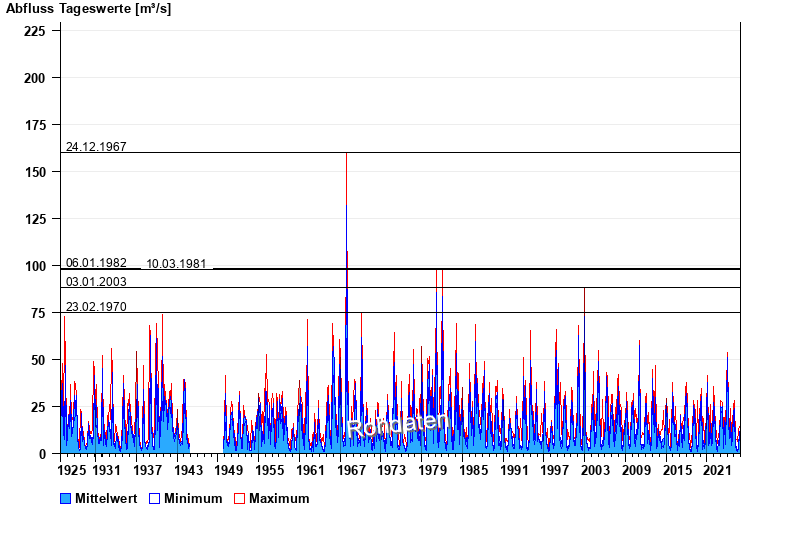
- 24.12.1967 Abfluss: 160 m³/s
- 06.01.1982 Abfluss: 98,3 m³/s
- 10.03.1981 Abfluss: 97,9 m³/s
- 03.01.2003 Abfluss: 88,2 m³/s
- 23.02.1970 Abfluss: 75 m³/s
| Date | Mean value [m³/s] | Maximum [m³/s] | Minimum [m³/s] |
|---|---|---|---|
| 16.12.2025 | 3.7 | 3.7 | 3.7 |
| 15.12.2025 | 3.91 | 4.22 | 3.54 |
| 14.12.2025 | 4.24 | 4.58 | 3.88 |
| 13.12.2025 | 4.82 | 5.32 | 4.4 |
| 12.12.2025 | 5.72 | 6.27 | 5.32 |
| 11.12.2025 | 6.98 | 8.29 | 6.27 |
| 10.12.2025 | 8.76 | 9.94 | 7.45 |
© Bayerisches Landesamt für Umwelt 2025