

Chart of year Brunnen / Mühlberger Ach
Discharge from 31.05.2023 to 30.05.2024
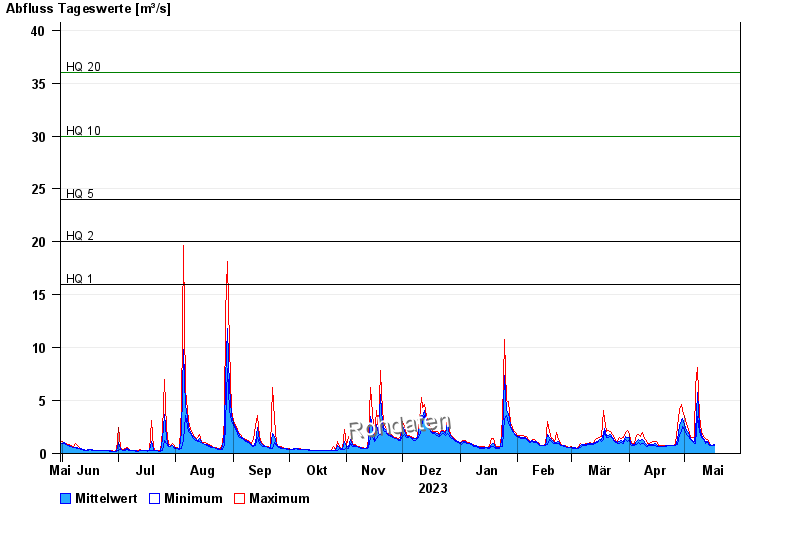
- HQ1 16 m³/s
- HQ2 20 m³/s
- HQ5 24 m³/s
- HQ10 30 m³/s
- HQ20 36 m³/s
- HQ50 44 m³/s
- HQ100 50 m³/s
| Date | Mean value [m³/s] | Maximum [m³/s] | Minimum [m³/s] |
|---|---|---|---|
| 30.05.2024 | 2.76 | 4.32 | 1.71 |
| 29.05.2024 | 2.08 | 2.68 | 1.71 |
| 28.05.2024 | 3.47 | 4.61 | 2.06 |
| 27.05.2024 | 1.26 | 2.06 | 1.07 |
| 26.05.2024 | 1.38 | 1.49 | 1.28 |
| 25.05.2024 | 1.54 | 1.83 | 1.39 |
| 24.05.2024 | 1.68 | 2.3 | 1.39 |
© Bayerisches Landesamt für Umwelt 2024