

Chart of year Brunnen / Mühlberger Ach
Discharge from 21.04.2024 to 20.04.2025
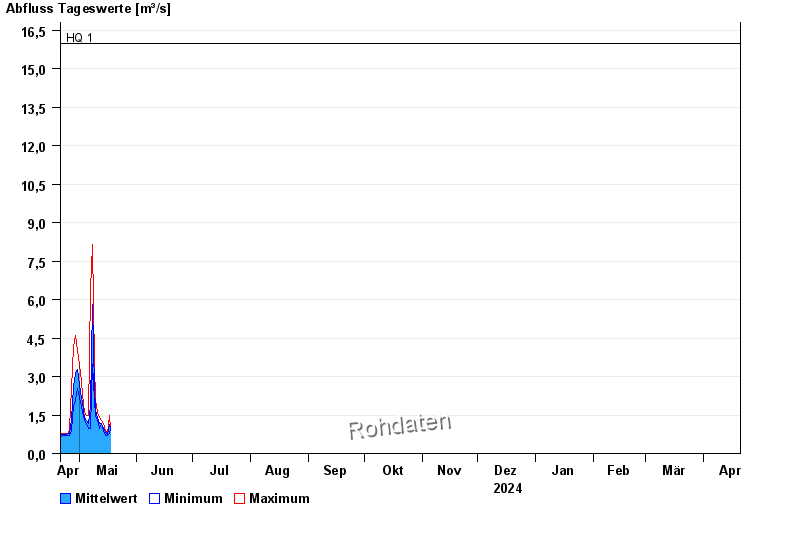
- HQ1 16 m³/s
- HQ2 20 m³/s
- HQ5 24 m³/s
- HQ10 30 m³/s
- HQ20 36 m³/s
- HQ50 44 m³/s
- HQ100 50 m³/s
| Date | Mean value [m³/s] | Maximum [m³/s] | Minimum [m³/s] |
|---|---|---|---|
| 03.05.2024 | 2.21 | 2.3 | 1.94 |
| 02.05.2024 | 2.13 | 2.8 | 1.83 |
| 01.05.2024 | 2.7 | 3.47 | 2.18 |
| 30.04.2024 | 3.28 | 4.03 | 2.55 |
| 29.04.2024 | 3.1 | 4.61 | 2.06 |
| 28.04.2024 | 2.6 | 4.18 | 1.83 |
| 27.04.2024 | 1.31 | 2.55 | 0.88 |
© Bayerisches Landesamt für Umwelt 2024