
- Start >
- Rivers >
- Discharge >
- Bayern >
- Böhmischbruck >
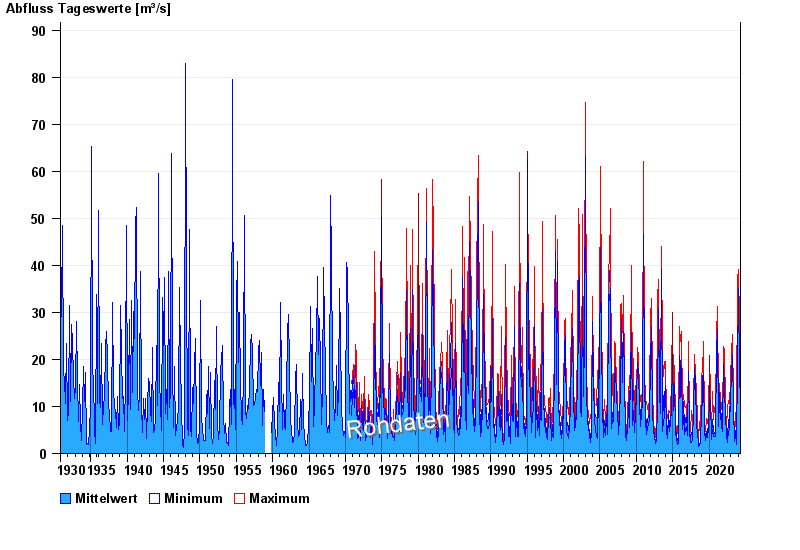
- Chart of total period

Chart of total period Böhmischbruck / Pfreimd
Discharge from 01.11.1930 to 26.04.2024
| Date | Mean value [m³/s] | Maximum [m³/s] | Minimum [m³/s] |
|---|---|---|---|
| 26.04.2024 | 6.95 | 7.09 | 6.88 |
| 25.04.2024 | 7.04 | 7.31 | 6.88 |
| 24.04.2024 | 7.78 | 8.61 | 6.24 |
| 23.04.2024 | 9.82 | 11.3 | 8.61 |
| 22.04.2024 | 11.6 | 12.2 | 11.3 |
| 21.04.2024 | 11.9 | 12.4 | 11.5 |
| 20.04.2024 | 11.5 | 12.6 | 10.2 |
© Bayerisches Landesamt für Umwelt 2024