

Chart of total period Birnbach / Rott
Discharge from 01.11.1930 to 30.04.2024
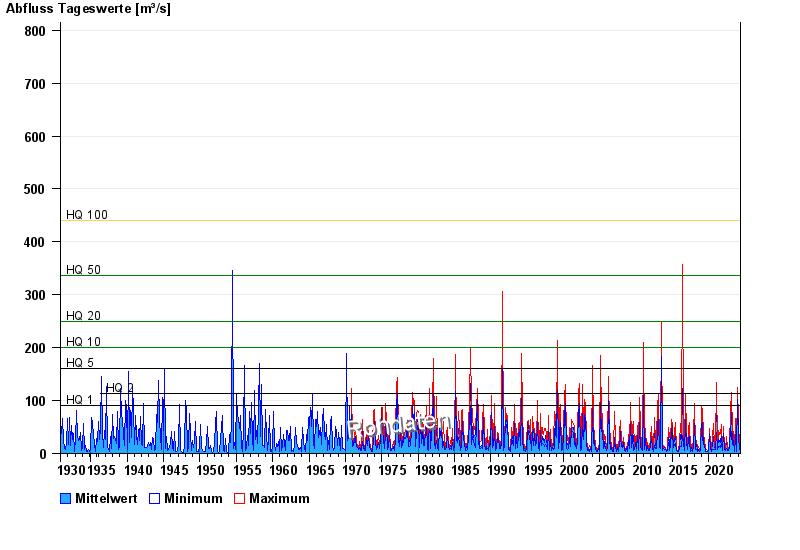
- HQ1 90 m³/s
- HQ2 113 m³/s
- HQ5 160 m³/s
- HQ10 200 m³/s
- HQ20 250 m³/s
- HQ50 337 m³/s
- HQ100 440 m³/s
| Date | Mean value [m³/s] | Maximum [m³/s] | Minimum [m³/s] |
|---|---|---|---|
| 30.04.2024 | 3.38 | 3.66 | 2.97 |
| 29.04.2024 | 3.62 | 3.92 | 3.41 |
| 28.04.2024 | 3.96 | 4.48 | 3.41 |
| 27.04.2024 | 4.15 | 4.19 | 3.92 |
| 26.04.2024 | 4.21 | 4.48 | 4.19 |
| 25.04.2024 | 4.92 | 6.16 | 4.19 |
| 24.04.2024 | 4.66 | 5.8 | 2.97 |
© Bayerisches Landesamt für Umwelt 2024