
- Start >
- Rivers >
- Discharge >
- Bayern >
- Biessenhofen >
- Chart of total period

Chart of total period Biessenhofen / Wertach
Discharge from 01.11.1920 to 16.12.2025
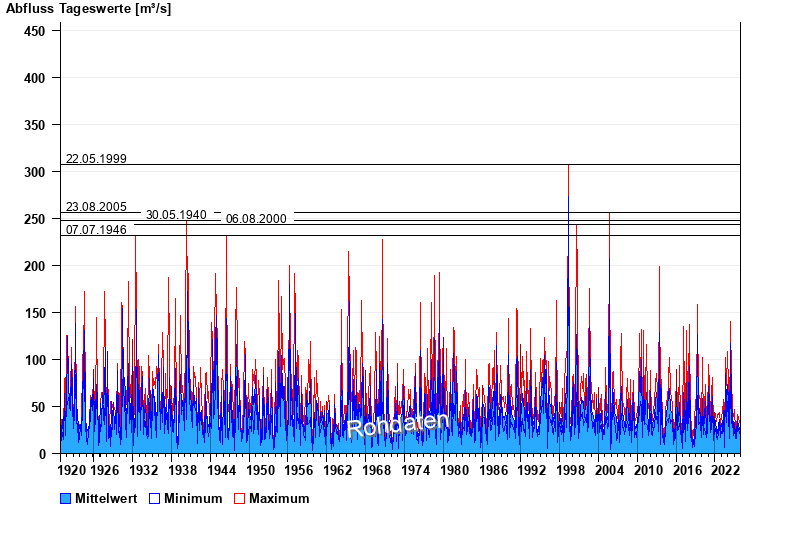
- 22.05.1999 Abfluss: 307 m³/s
- 23.08.2005 Abfluss: 256 m³/s
- 30.05.1940 Abfluss: 248 m³/s
- 06.08.2000 Abfluss: 243 m³/s
- 07.07.1946 Abfluss: 232 m³/s
| Date | Mean value [m³/s] | Maximum [m³/s] | Minimum [m³/s] |
|---|---|---|---|
| 16.12.2025 | 5.95 | 6.44 | 5.36 |
| 15.12.2025 | 6.36 | 6.82 | 6.06 |
| 14.12.2025 | 7 | 7.61 | 6.44 |
| 13.12.2025 | 8.03 | 8.43 | 7.21 |
| 12.12.2025 | 9.37 | 10.2 | 8.43 |
| 11.12.2025 | 11.4 | 15.2 | 10.2 |
| 10.12.2025 | 20.3 | 23.7 | 15.2 |
© Bayerisches Landesamt für Umwelt 2025