

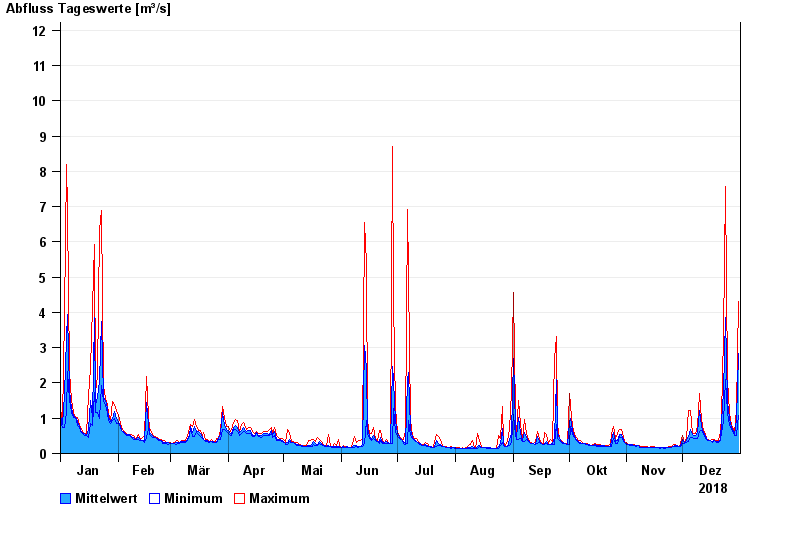
Chart of year Bernau / Bernauer Ache
Discharge from 01.01.2018 to 31.12.2018
- 04.08.2020 Abfluss: 55,2 m³/s
- 02.06.2013 Abfluss: 37,1 m³/s
- 03.06.2010 Abfluss: 34,3 m³/s
- 24.06.2009 Abfluss: 27,2 m³/s
- 09.05.2007 Abfluss: 25,9 m³/s
| Date | Mean value [m³/s] | Maximum [m³/s] | Minimum [m³/s] |
|---|---|---|---|
| 31.12.2018 | 2.83 | 4.3 | 1.09 |
| 30.12.2018 | 0.951 | 1.24 | 0.513 |
| 29.12.2018 | 0.547 | 0.565 | 0.513 |
| 28.12.2018 | 0.638 | 0.675 | 0.563 |
| 27.12.2018 | 0.749 | 0.797 | 0.674 |
| 26.12.2018 | 0.981 | 1.15 | 0.796 |
| 25.12.2018 | 1.48 | 2.11 | 1.15 |
© Bayerisches Landesamt für Umwelt 2024