
- Start >
- Rivers >
- Discharge >
- Bayern >
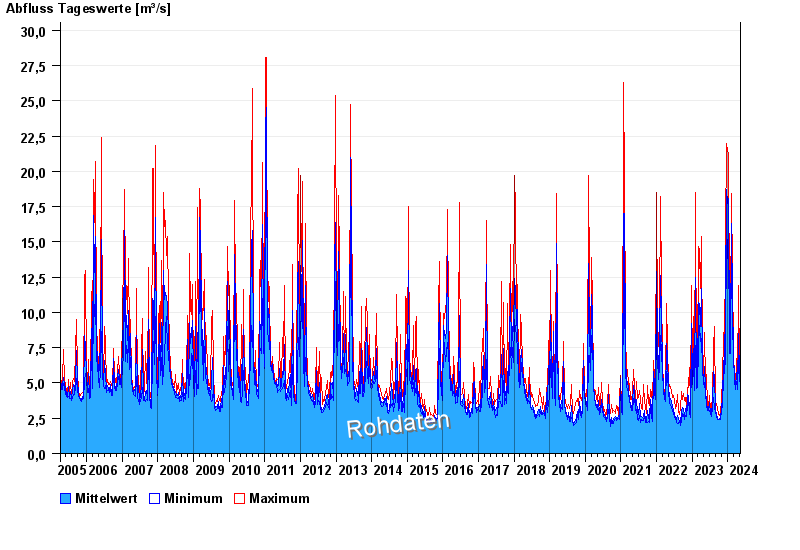
- Behringersmühle >
- Chart of total period

Chart of total period Behringersmühle / Wiesent
Discharge from 07.04.2005 to 10.05.2024
| Date | Mean value [m³/s] | Maximum [m³/s] | Minimum [m³/s] |
|---|---|---|---|
| 10.05.2024 | 4.36 | 4.4 | 4.27 |
| 09.05.2024 | 4.41 | 4.53 | 4.27 |
| 08.05.2024 | 4.64 | 4.81 | 4.53 |
| 07.05.2024 | 5.12 | 5.52 | 4.81 |
| 06.05.2024 | 4.91 | 5.22 | 4.67 |
| 05.05.2024 | 4.4 | 4.67 | 4.27 |
| 04.05.2024 | 4.36 | 4.67 | 3.77 |
© Bayerisches Landesamt für Umwelt 2024