

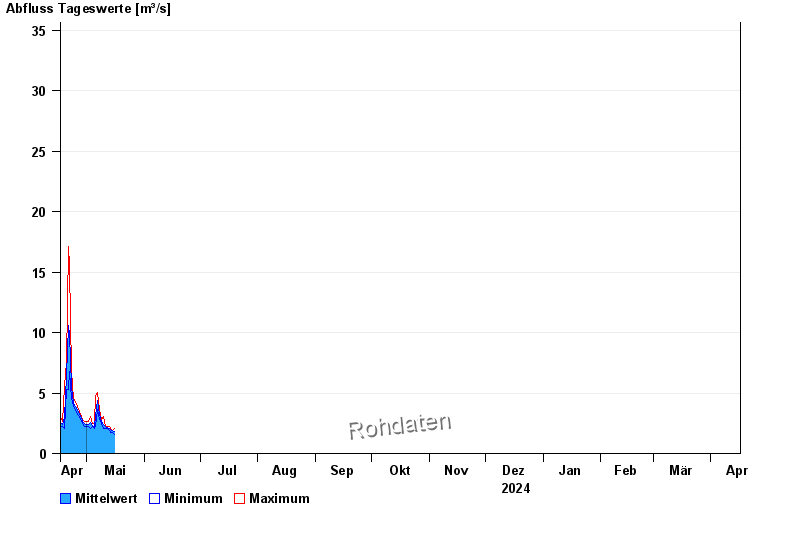
Chart of year Bayreuth / Roter Main
Discharge from 17.04.2024 to 16.04.2025
- HQ1 48 m³/s
- HQ2 62 m³/s
- HQ5 78 m³/s
- HQ10 95 m³/s
- HQ20 110 m³/s
- HQ50 135 m³/s
- HQ100 155 m³/s
| Date | Mean value [m³/s] | Maximum [m³/s] | Minimum [m³/s] |
|---|---|---|---|
| 29.04.2024 | 2.67 | 2.84 | 2.46 |
| 28.04.2024 | 2.96 | 3.03 | 2.64 |
| 27.04.2024 | 3.23 | 3.44 | 3.03 |
| 26.04.2024 | 3.59 | 3.87 | 3.24 |
| 25.04.2024 | 3.92 | 4.32 | 3.65 |
| 24.04.2024 | 4.13 | 4.54 | 3.87 |
| 23.04.2024 | 5.51 | 6.78 | 4.54 |
© Bayerisches Landesamt für Umwelt 2024