

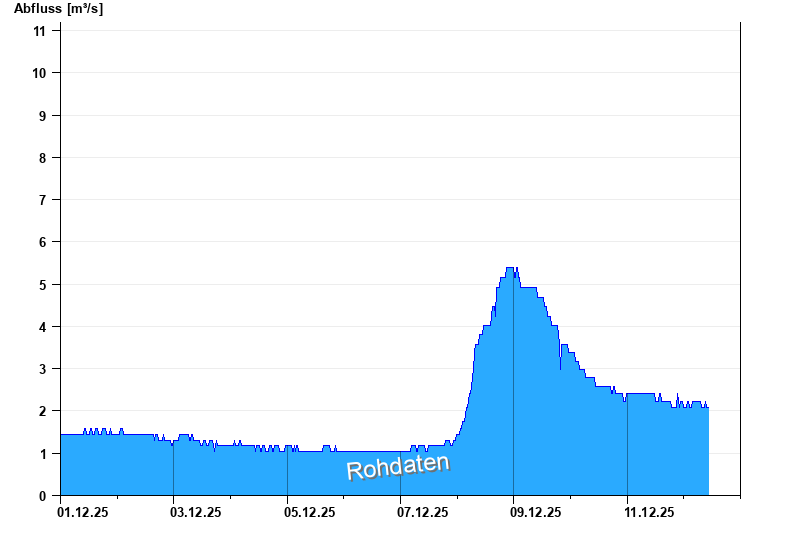
Chart of month Bayreuth / Roter Main
Discharge from 01.12.2025 to 12.12.2025
- HQ1 48 m³/s
- HQ2 62 m³/s
- HQ5 78 m³/s
- HQ10 95 m³/s
- HQ20 110 m³/s
- HQ50 135 m³/s
- HQ100 155 m³/s
| Date | Runoff [m³/s] |
|---|---|
| 12.12.2025 13:00 | 1.9 |
| 12.12.2025 12:45 | 1.9 |
| 12.12.2025 12:30 | 2.07 |
| 12.12.2025 12:15 | 2.07 |
| 12.12.2025 12:00 | 2.07 |
| 12.12.2025 11:45 | 2.07 |
| 12.12.2025 11:30 | 2.07 |
© Bayerisches Landesamt für Umwelt 2025