

Chart of year Bärenthal / Trubach
Discharge from 07.12.2021 to 06.12.2022
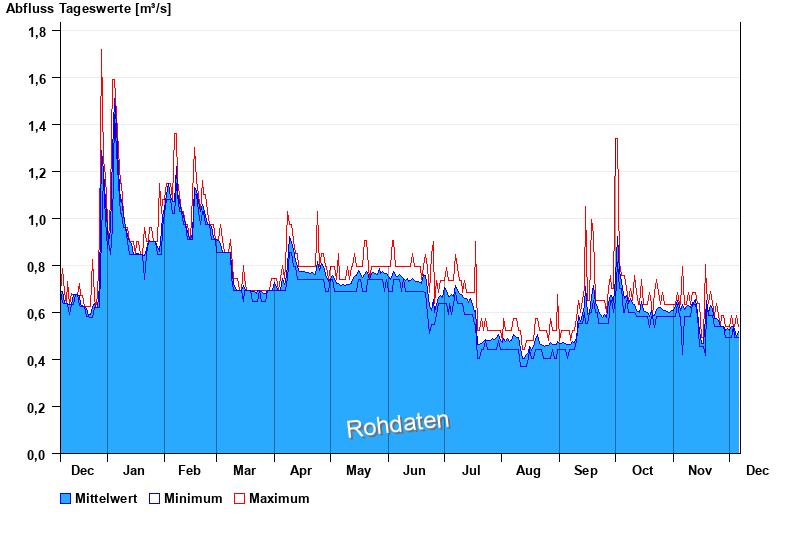
| Date | Mean value [m³/s] | Maximum [m³/s] | Minimum [m³/s] |
|---|---|---|---|
| 06.12.2022 | 0.518 | 0.538 | 0.494 |
| 05.12.2022 | 0.498 | 0.587 | 0.494 |
| 04.12.2022 | 0.526 | 0.538 | 0.494 |
| 03.12.2022 | 0.538 | 0.538 | 0.538 |
| 02.12.2022 | 0.539 | 0.587 | 0.494 |
| 01.12.2022 | 0.521 | 0.538 | 0.494 |
| 30.11.2022 | 0.532 | 0.538 | 0.494 |
© Bayerisches Landesamt für Umwelt 2025