
- Start >
- Rivers >
- Discharge >
- Bayern >
- Bad Wiessee >
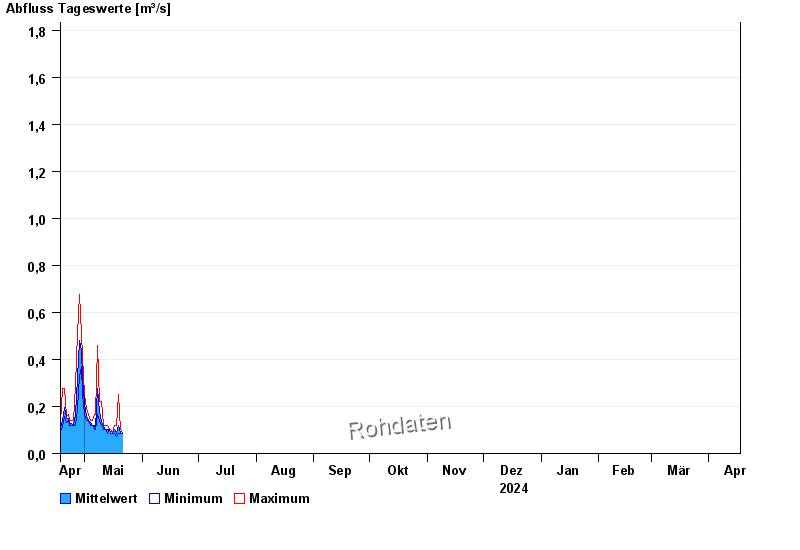
- Chart of year

Chart of year Bad Wiessee / Zeiselbach
Discharge from 18.04.2024 to 17.04.2025
- HQ1 3 m³/s
- HQ2 4 m³/s
- HQ5 6,6 m³/s
- HQ10 9,7 m³/s
- HQ20 13 m³/s
- HQ50 17 m³/s
- HQ100 20 m³/s
| Date | Mean value [m³/s] | Maximum [m³/s] | Minimum [m³/s] |
|---|---|---|---|
| 30.04.2024 | 0.346 | 0.413 | 0.288 |
| 29.04.2024 | 0.437 | 0.509 | 0.369 |
| 28.04.2024 | 0.479 | 0.675 | 0.327 |
| 27.04.2024 | 0.325 | 0.509 | 0.191 |
| 26.04.2024 | 0.167 | 0.288 | 0.12 |
| 25.04.2024 | 0.123 | 0.141 | 0.12 |
| 24.04.2024 | 0.126 | 0.141 | 0.12 |
© Bayerisches Landesamt für Umwelt 2024