
- Start >
- Rivers >
- Discharge >
- Bayern >
- Bad Wiessee >
- Chart of year

Chart of year Bad Wiessee / Zeiselbach
Discharge from 01.01.2023 to 31.12.2023
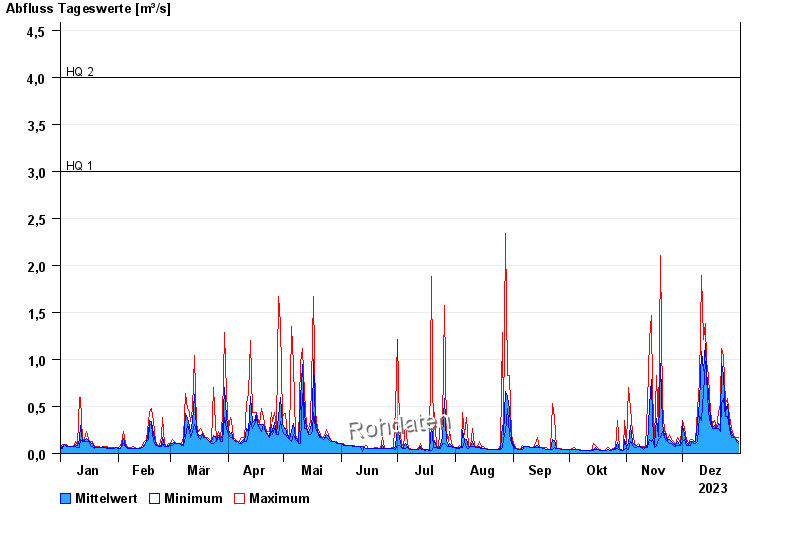
- HQ1 3 m³/s
- HQ2 4 m³/s
- HQ5 6,6 m³/s
- HQ10 9,7 m³/s
- HQ20 13 m³/s
- HQ50 17 m³/s
- HQ100 20 m³/s
| Date | Mean value [m³/s] | Maximum [m³/s] | Minimum [m³/s] |
|---|---|---|---|
| 31.12.2023 | 0.126 | 0.175 | 0.108 |
| 30.12.2023 | 0.145 | 0.175 | 0.128 |
| 29.12.2023 | 0.175 | 0.175 | 0.175 |
| 28.12.2023 | 0.18 | 0.203 | 0.175 |
| 27.12.2023 | 0.208 | 0.269 | 0.175 |
| 26.12.2023 | 0.305 | 0.389 | 0.269 |
| 25.12.2023 | 0.517 | 0.589 | 0.389 |
© Bayerisches Landesamt für Umwelt 2024