

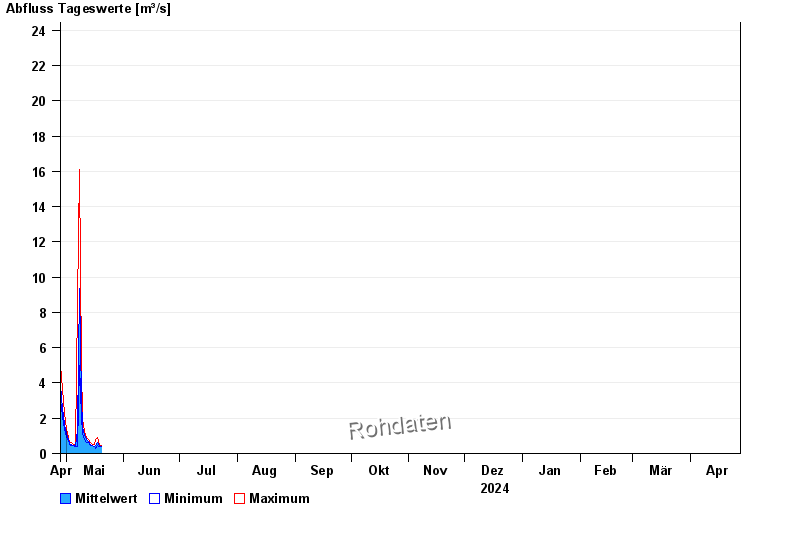
Chart of year Bad Trißl / Auerbach
Discharge from 28.04.2024 to 27.04.2025
- 31.07.1977 Abfluss: 90,6 m³/s
- 21.05.1999 Abfluss: 79 m³/s
- 20.07.1981 Abfluss: 75,8 m³/s
- 12.08.2002 Abfluss: 73,3 m³/s
- 24.08.1955 Abfluss: 70,9 m³/s
| Date | Mean value [m³/s] | Maximum [m³/s] | Minimum [m³/s] |
|---|---|---|---|
| 09.05.2024 | 4.15 | 5.28 | 3.21 |
| 08.05.2024 | 9.7 | 16.5 | 5.28 |
| 07.05.2024 | 1.42 | 8.91 | 0.435 |
| 06.05.2024 | 0.5 | 0.567 | 0.435 |
| 05.05.2024 | 0.514 | 0.567 | 0.498 |
| 04.05.2024 | 0.617 | 0.724 | 0.498 |
| 03.05.2024 | 0.641 | 0.724 | 0.567 |
© Bayerisches Landesamt für Umwelt 2024