
- Start >
- Rivers >
- Discharge >
- Bayern >
- Bad Aibling >
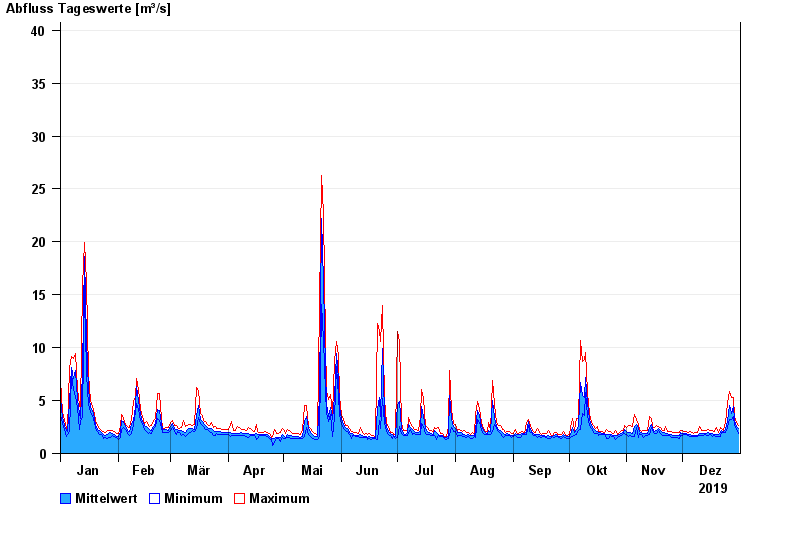
- Chart of year

Chart of year Bad Aibling / Glonn
Discharge from 01.01.2019 to 31.12.2019
- 04.08.2020 Abfluss: 74,5 m³/s
- 03.06.2013 Abfluss: 70,5 m³/s
- 31.05.1940 Abfluss: 64,1 m³/s
- 07.07.1946 Abfluss: 57 m³/s
- 09.07.1954 Abfluss: 54,7 m³/s
| Date | Mean value [m³/s] | Maximum [m³/s] | Minimum [m³/s] |
|---|---|---|---|
| 31.12.2019 | 2.33 | 2.63 | 1.88 |
| 30.12.2019 | 2.56 | 2.92 | 2.36 |
| 29.12.2019 | 3.11 | 3.54 | 2.63 |
| 28.12.2019 | 4.4 | 5.33 | 3.54 |
| 27.12.2019 | 3.81 | 5.33 | 3.21 |
| 26.12.2019 | 4.52 | 5.9 | 3.2 |
| 25.12.2019 | 3 | 4.75 | 2.46 |
© Bayerisches Landesamt für Umwelt 2024