
- Start >
- Rivers >
- Discharge >
- Bayern >
- Bad Aibling >
- Chart of year

Chart of year Bad Aibling / Glonn
Discharge from 29.03.2024 to 28.03.2025
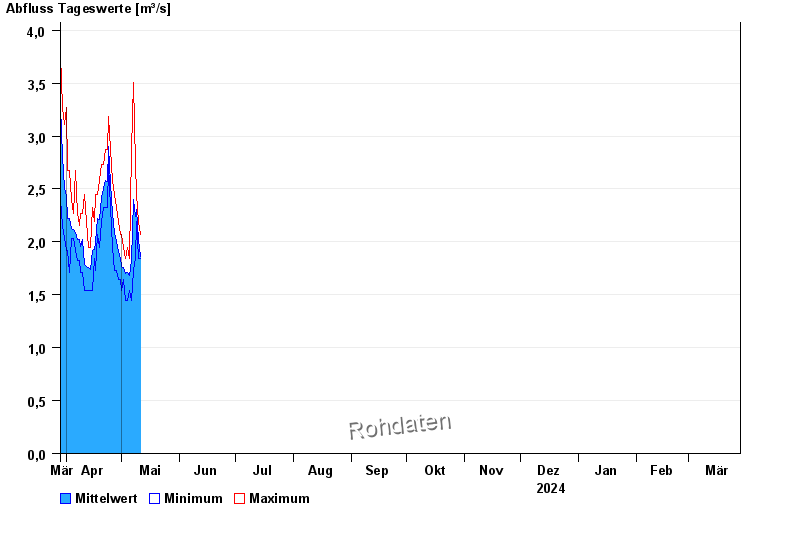
| Date | Mean value [m³/s] | Maximum [m³/s] | Minimum [m³/s] |
|---|---|---|---|
| 28.04.2024 | 2.19 | 2.19 | 2.19 |
| 27.04.2024 | 2.08 | 2.45 | 1.73 |
| 26.04.2024 | 2.27 | 2.58 | 1.95 |
| 25.04.2024 | 2.55 | 2.87 | 2.32 |
| 24.04.2024 | 2.9 | 3.18 | 2.73 |
| 23.04.2024 | 2.57 | 2.87 | 2.32 |
| 22.04.2024 | 2.58 | 2.87 | 2.32 |
© Bayerisches Landesamt für Umwelt 2024