
- Start >
- Rivers >
- Discharge >
- Bayern >
- Bad Aibling >
- Chart of year

Chart of year Bad Aibling / Glonn
Discharge from 01.12.2023 to 30.11.2024
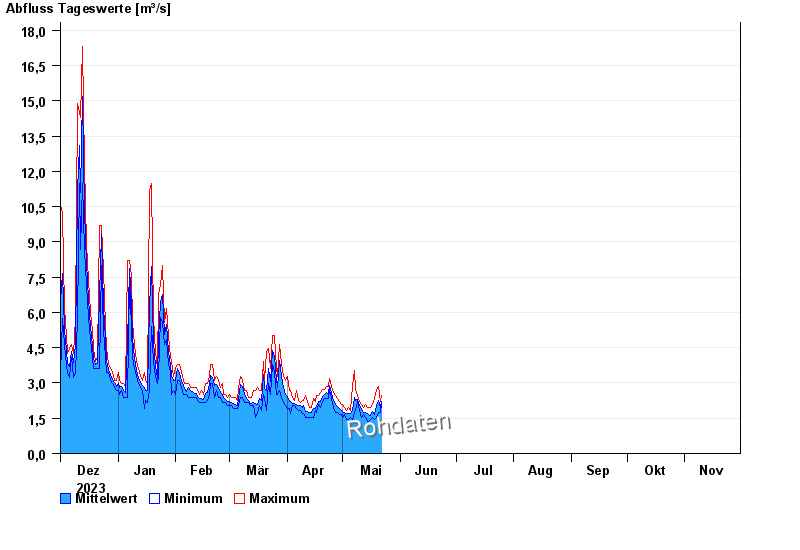
| Date | Mean value [m³/s] | Maximum [m³/s] | Minimum [m³/s] |
|---|---|---|---|
| 18.06.2024 | 2.79 | 3.06 | 2.6 |
| 17.06.2024 | 2.68 | 5.34 | 2.19 |
| 16.06.2024 | 2.66 | 2.75 | 2.33 |
| 15.06.2024 | 2.66 | 2.9 | 2.46 |
| 14.06.2024 | 2.95 | 3.21 | 2.75 |
| 13.06.2024 | 3.4 | 3.88 | 2.9 |
| 12.06.2024 | 4.41 | 5.15 | 3.21 |
© Bayerisches Landesamt für Umwelt 2024