
- Start >
- Rivers >
- Discharge >
- Bayern >
- Bad Aibling >
- Chart of year

Chart of year Bad Aibling / Glonn
Discharge from 30.01.2023 to 29.01.2024
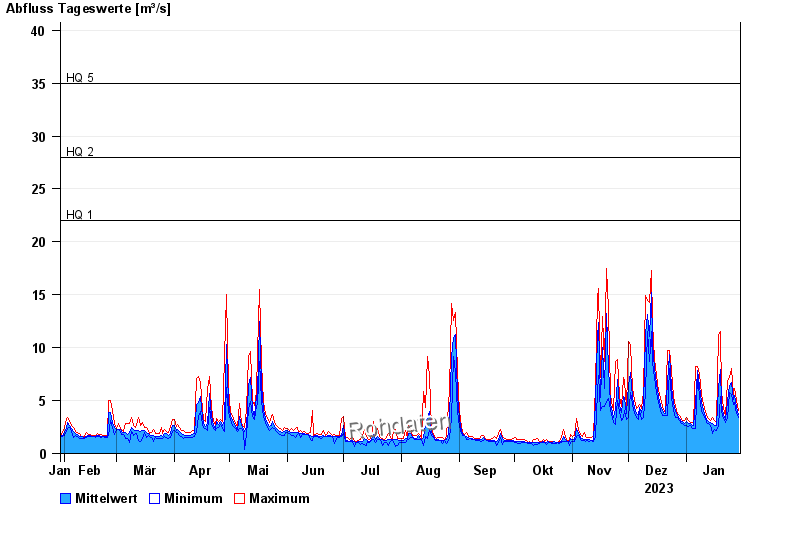
- HQ1 22 m³/s
- HQ2 28 m³/s
- HQ5 35 m³/s
- HQ10 43 m³/s
- HQ20 52 m³/s
- HQ50 62 m³/s
- HQ100 70 m³/s
| Date | Mean value [m³/s] | Maximum [m³/s] | Minimum [m³/s] |
|---|---|---|---|
| 29.01.2024 | 3.73 | 4.1 | 3.43 |
| 28.01.2024 | 4.33 | 5.02 | 3.77 |
| 27.01.2024 | 5.5 | 6.18 | 4.83 |
| 26.01.2024 | 5.06 | 5.59 | 4.65 |
| 25.01.2024 | 6.74 | 8.01 | 5.59 |
| 24.01.2024 | 6.42 | 7.18 | 5.79 |
| 23.01.2024 | 4.91 | 6.77 | 3.27 |
© Bayerisches Landesamt für Umwelt 2024