
- Start >
- Rivers >
- Discharge >
- Bayern >
- Bad Aibling >
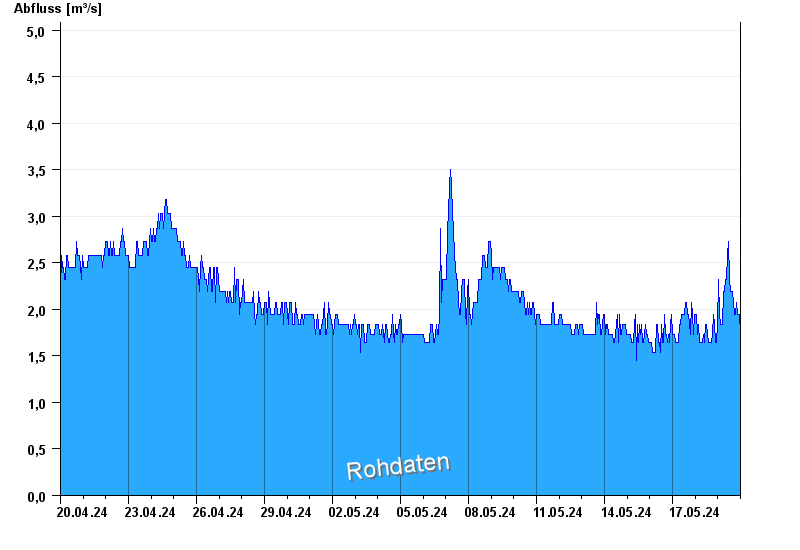
- Chart of month

Chart of month Bad Aibling / Glonn
Discharge from 20.04.2024 to 19.05.2024
- 04.08.2020 Abfluss: 74,5 m³/s
- 03.06.2013 Abfluss: 70,5 m³/s
- 31.05.1940 Abfluss: 64,1 m³/s
- 07.07.1946 Abfluss: 57 m³/s
- 09.07.1954 Abfluss: 54,7 m³/s
| Date | Runoff [m³/s] |
|---|---|
| 17.05.2024 10:30 | 1.84 |
| 17.05.2024 10:15 | 1.84 |
| 17.05.2024 10:00 | 1.84 |
| 17.05.2024 09:45 | 1.95 |
| 17.05.2024 09:30 | 1.95 |
| 17.05.2024 09:15 | 1.95 |
| 17.05.2024 09:00 | 1.84 |
© Bayerisches Landesamt für Umwelt 2024