
- Start >
- Rivers >
- Discharge >
- Bayern >
- Augsburg u. d. Wertachmündung >
- Chart of year

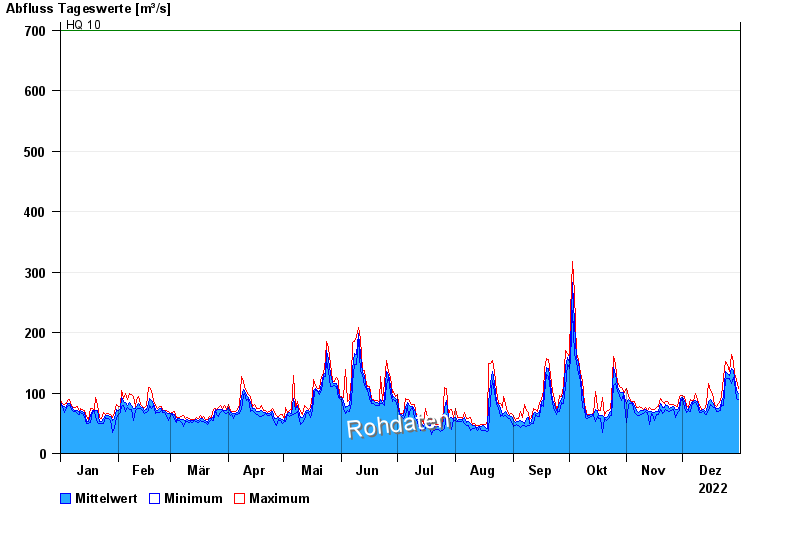
Chart of year Augsburg u. d. Wertachmündung / Lech
Discharge from 01.01.2022 to 31.12.2022
note
Abflussermittlung bei Hochwasser durch Geschiebeverlagerung beeinflusst
- HQ10 700 m³/s
- HQ100 1350 m³/s
| Date | Mean value [m³/s] | Maximum [m³/s] | Minimum [m³/s] |
|---|---|---|---|
| 31.12.2022 | 99.3 | 107 | 89.8 |
| 30.12.2022 | 105 | 122 | 91.7 |
| 29.12.2022 | 124 | 132 | 118 |
| 28.12.2022 | 137 | 150 | 126 |
| 27.12.2022 | 140 | 164 | 116 |
| 26.12.2022 | 129 | 136 | 124 |
| 25.12.2022 | 133 | 148 | 124 |
© Bayerisches Landesamt für Umwelt 2024