

Chart of year Auerbach / Hengersberger Ohe
Discharge from 01.01.2024 to 31.12.2024
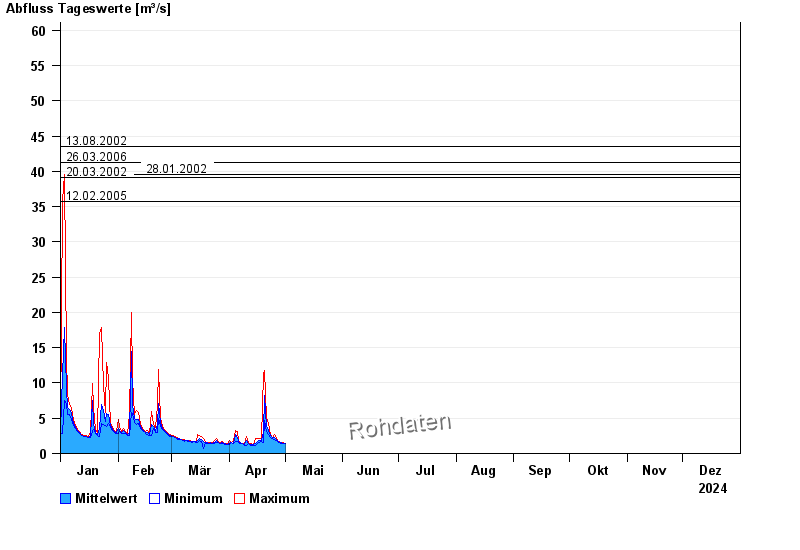
- 13.08.2002 Abfluss: 43,5 m³/s
- 26.03.2006 Abfluss: 41,2 m³/s
- 28.01.2002 Abfluss: 39,6 m³/s
- 20.03.2002 Abfluss: 39,1 m³/s
- 12.02.2005 Abfluss: 35,7 m³/s
| Date | Mean value [m³/s] | Maximum [m³/s] | Minimum [m³/s] |
|---|---|---|---|
| 04.06.2024 | 4.25 | 5.43 | 3.44 |
| 03.06.2024 | 7.02 | 10.6 | 4.78 |
| 02.06.2024 | 5.91 | 8.56 | 4.46 |
| 01.06.2024 | 9.56 | 23.5 | 5.18 |
| 31.05.2024 | 3.94 | 10.7 | 1.99 |
| 30.05.2024 | 2.11 | 2.67 | 1.75 |
| 29.05.2024 | 1.98 | 2.22 | 1.75 |
© Bayerisches Landesamt für Umwelt 2024