

Chart of total period Auerbach / Hengersberger Ohe
Discharge from 01.11.1964 to 26.04.2024
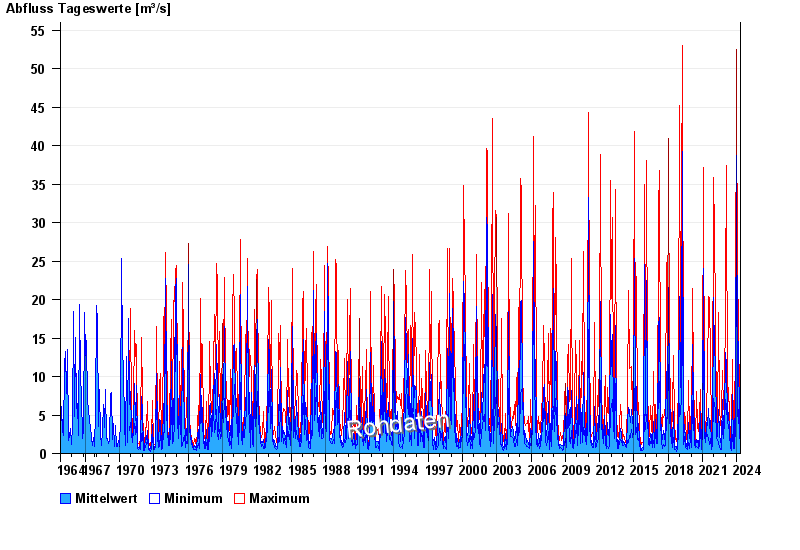
| Date | Mean value [m³/s] | Maximum [m³/s] | Minimum [m³/s] |
|---|---|---|---|
| 26.04.2024 | 2.13 | 2.29 | 1.99 |
| 25.04.2024 | 2.26 | 2.75 | 1.99 |
| 24.04.2024 | 2.21 | 2.29 | 2.06 |
| 23.04.2024 | 2.49 | 2.75 | 2.29 |
| 22.04.2024 | 3.21 | 4.3 | 2.75 |
| 21.04.2024 | 3.87 | 5.1 | 3.05 |
| 20.04.2024 | 8.17 | 11.8 | 4.62 |
© Bayerisches Landesamt für Umwelt 2024