

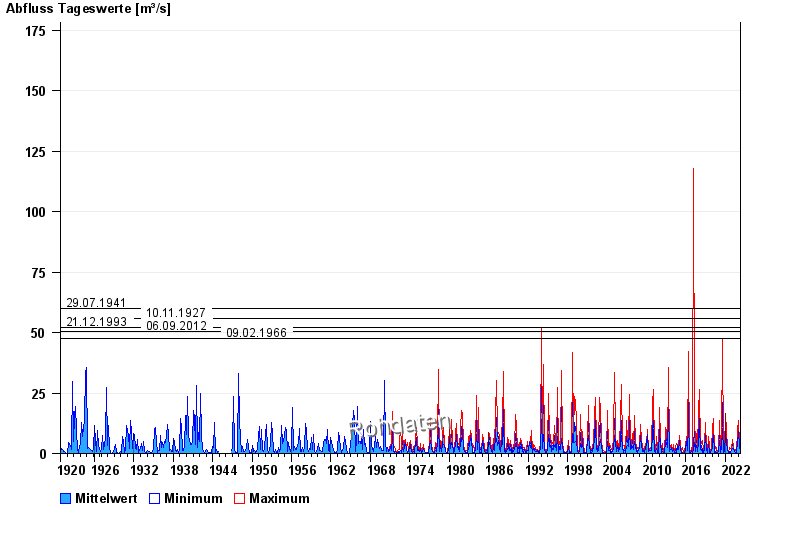
Chart of total period Ansbach / Fränkische Rezat
Discharge from 01.11.1920 to 29.04.2024
note
Wasserstand und Abfluss wird zeitweise durch Biberdamm beeinflusst.
- 29.07.1941 Abfluss: 60 m³/s
- 10.11.1927 Abfluss: 56 m³/s
- 21.12.1993 Abfluss: 51,9 m³/s
- 06.09.2012 Abfluss: 50,5 m³/s
- 09.02.1966 Abfluss: 47,6 m³/s
| Date | Mean value [m³/s] | Maximum [m³/s] | Minimum [m³/s] |
|---|---|---|---|
| 29.04.2024 | 0.304 | 0.304 | 0.304 |
| 28.04.2024 | 0.304 | 0.335 | 0.304 |
| 27.04.2024 | 0.335 | 0.335 | 0.335 |
| 26.04.2024 | 0.355 | 0.368 | 0.335 |
| 25.04.2024 | 0.368 | 0.368 | 0.368 |
| 24.04.2024 | 0.373 | 0.403 | 0.368 |
| 23.04.2024 | 0.431 | 0.478 | 0.403 |
© Bayerisches Landesamt für Umwelt 2024