
- Start >
- Rivers >
- Discharge >
- Bayern >
- Ampermoching >
- Chart of year

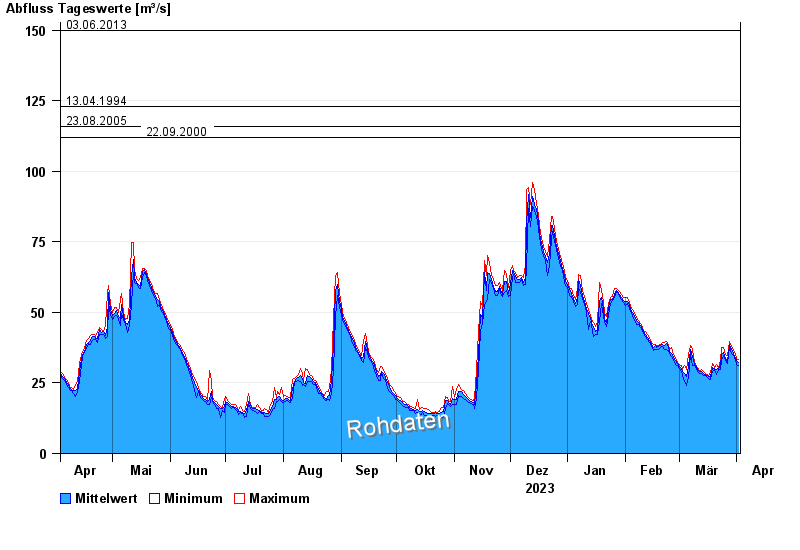
Chart of year Ampermoching / Amper
Discharge from 03.04.2023 to 02.04.2024
- 25.05.1999 Abfluss: 171 m³/s
- 03.06.2013 Abfluss: 150 m³/s
- 13.04.1994 Abfluss: 123 m³/s
- 23.08.2005 Abfluss: 116 m³/s
- 22.09.2000 Abfluss: 112 m³/s
| Date | Mean value [m³/s] | Maximum [m³/s] | Minimum [m³/s] |
|---|---|---|---|
| 02.04.2024 | 32.1 | 33.2 | 31.1 |
| 01.04.2024 | 32.9 | 33.7 | 31.5 |
| 31.03.2024 | 33.8 | 35 | 32.8 |
| 30.03.2024 | 35.4 | 36.4 | 35 |
| 29.03.2024 | 36.8 | 37.8 | 35.5 |
| 28.03.2024 | 38.6 | 39.7 | 37.8 |
| 27.03.2024 | 32.6 | 34.6 | 32 |
© Bayerisches Landesamt für Umwelt 2024