

Chart of year Amberg / Vils
Discharge from 20.04.2024 to 19.04.2025
- 23.02.1970 Abfluss: 80,5 m³/s
- 26.01.1995 Abfluss: 63,9 m³/s
- 11.07.1954 Abfluss: 63,3 m³/s
- 03.01.2003 Abfluss: 61,9 m³/s
- 21.12.1993 Abfluss: 60,9 m³/s
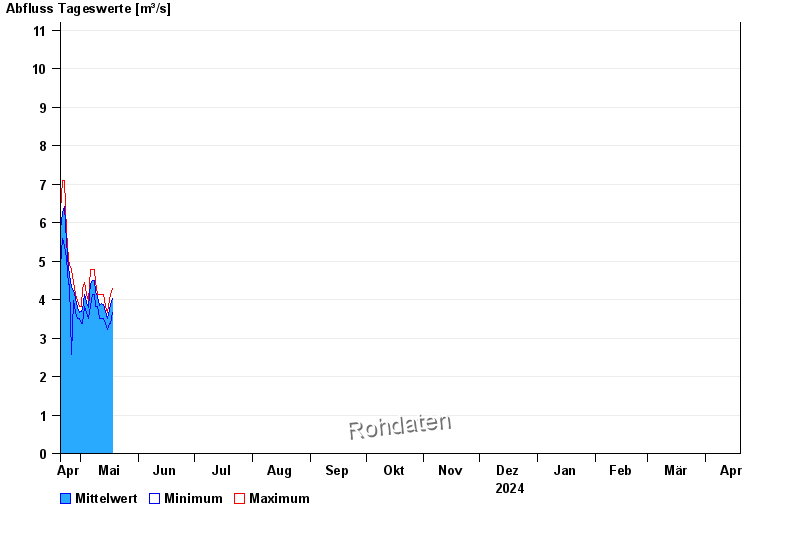
| Date | Mean value [m³/s] | Maximum [m³/s] | Minimum [m³/s] |
|---|---|---|---|
| 04.06.2024 | 15.8 | 17.5 | 13.7 |
| 03.06.2024 | 22.6 | 31.4 | 17.5 |
| 02.06.2024 | 30.5 | 34.3 | 22.2 |
| 01.06.2024 | 10.5 | 21.9 | 6.96 |
| 31.05.2024 | 6.47 | 8.55 | 5.83 |
| 30.05.2024 | 5.46 | 7.15 | 4.44 |
| 29.05.2024 | 4.91 | 5.12 | 4.61 |
© Bayerisches Landesamt für Umwelt 2024